This document shows you how to test and monitor the online serving performance of machine learning (ML) models that are deployed to AI Platform Prediction. The document uses Locust, an open-source tool for load testing.
The document is for data scientists and MLOps engineers who want to monitor the service workload, latency, and resource utilization of their ML models in production. For general information about optimizing performance, see Best practices for performance and cost optimization for machine learning.
The document assumes that you have some experience with Google Cloud, TensorFlow, AI Platform Prediction, Cloud Monitoring, and Jupyter notebooks.
The document is accompanied by a GitHub repository that includes the code and a deployment guide for implementing the system that’s described in this document. The tasks are incorporated into Jupyter notebooks.
Costs
The notebooks that you work with in this document use the following billable components of Google Cloud:
- Notebooks
- AI Platform Prediction
- Cloud Storage
- Cloud Monitoring
- Google Kubernetes Engine (GKE)
To generate a cost estimate based on your projected usage, use the pricing calculator.
Before you begin
- If you’re new to Google Cloud, create an account to evaluate how our products perform in real-world scenarios. New customers also get $300 in free credits to run, test, and deploy workloads.
- In the Google Cloud Console, on the project selector page, select or create a Google Cloud project.
Go to project selector
- Make sure that billing is enabled for your Cloud project. Learn how to confirm that billing is enabled for your project.
Architecture overview
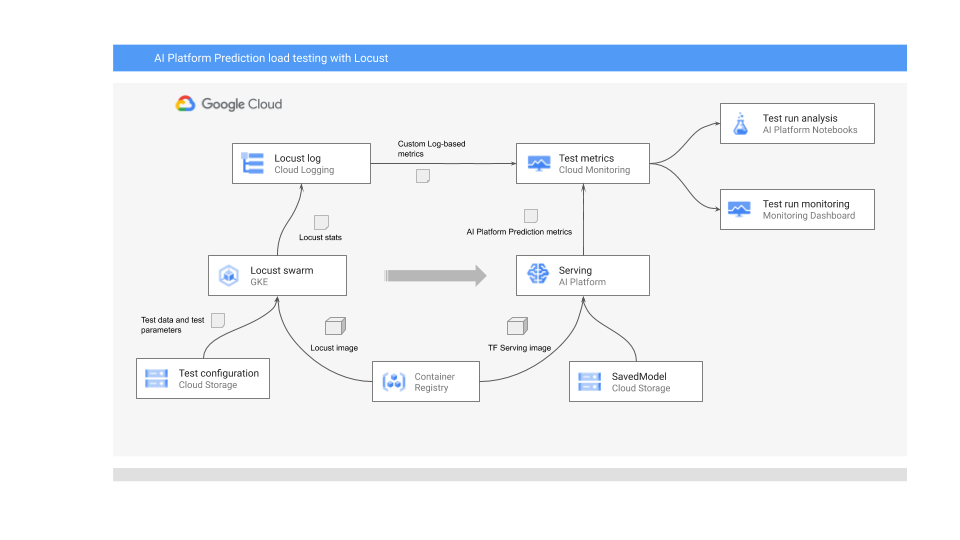
The following diagram shows the system architecture for deploying the ML model for online prediction, running the load test, and collecting and analyzing the metrics for ML model serving performance.
The diagram shows the following flow:
- Your trained model might be in Cloud Storage—for example, a TensorFlow SavedModel or scikit-learn joblib. Alternatively, it might be incorporated into a custom serving container in Container Registry—for example, TorchServe for serving PyTorch models.
- The model is deployed to AI Platform Prediction as a REST API. AI Platform Prediction is a fully managed service for model serving that supports different machine types, supports autoscaling based on resource utilization, and supports various GPU accelerators.
- Locust is used to implement a test task (that is, user behavior). It does so by calling the ML model that’s deployed to AI Platform Prediction and running it at scale on Google Kubernetes Engine (GKE). This simulates many simultaneous user calls for load-testing the model prediction service. You can monitor the progress of the tests using the Locust web interface.
- Locust logs test statistics to Cloud Logging. The log entries that are created by the Locust test are used to define a set of logs-based metrics in Cloud Monitoring. These metrics complement standard AI Platform Prediction metrics.
- Both AI Platform metrics and the custom Locust metrics are available for visualization in a Cloud Monitoring dashboard in real time. After the test finishes, the metrics are also programmatically collected so that you can analyze and visualize the metrics in Notebooks.
The Jupyter notebooks for this scenario
All the tasks for preparing and deploying the model, running the Locust test, and collecting and analyzing the test results are coded in the following Jupyter notebooks. To perform the tasks, you run the sequence of cells in each notebook.
01-prepare-and-deploy.ipynb. You run this notebook to prepare a TensorFlow SavedModel for serving and to deploy the model to AI Platform Prediction.02-perf-testing.ipynb. You run this notebook to create logs-based metrics in Cloud Monitoring for the Locust test, and to deploy the Locust test to GKE and run it.03-analyze-results.ipynb. You run this notebook to collect and analyze the Locust load test results from the standard AI Platform metrics that are created by Cloud Monitoring, and from the custom Locust metrics.
Initializing your environment
As described in the README.md file of the associated GitHub repository, you need to perform the following steps to prepare the environment to run the notebooks:
- In your Cloud project, create a Cloud Storage bucket, which is required in order to store the trained model and the Locust test configuration. Make a note of the name you use for the bucket because you need it later.
- Create a Cloud Monitoring workspace in your project.
- Create a Google Kubernetes Engine cluster that has the required CPUs. The node pool must have access to the Cloud APIs.
- Create an Notebooks instance that uses TensorFlow 2. For this tutorial, you don’t need GPUs because you don’t train the model. (GPUs can be useful in other scenarios, in particular for speeding up the training of your models.)
Opening JupyterLab
To go through the tasks for the scenario, you need to open the JupyterLab environment and get the notebooks.
- In the Cloud Console, go to the Notebooks page and click Open Jupyterlab next to the notebook environment that you created.This opens the JupyterLab environment in your browser.
- To launch a terminal tab, click the Terminal icon in the Launcher tab.
- In the terminal, clone the
mlops-on-gcpGitHub repository:git clone https://github.com/GoogleCloudPlatform/mlops-on-gcp.gitWhen the command finishes, you see the
mlops-on-gcpfolder in the file browser. In that folder, you see the notebooks that you work with in this document.
Configuring notebook settings
In this section, you set variables in the notebooks with values that are specific to your context, and you prepare the environment to run the code for the scenario.
- Navigate to the
model_serving/caip-load-testingdirectory. - For each of the three notebooks, do the following:
- Open the notebook.
- Run the cells under Configure Google Cloud environment settings.
The following sections highlight key parts of the process and explain aspects of the design and of the code.
Serving the model for online prediction
The ML model that’s used in this document uses the pretrained ResNet V2 101 image classification model from TensorFlow Hub. However, you can adapt the system design patterns and techniques from this document to other domains and to other types of models.
The code for preparing and serving the ResNet 101 model is in the 01-prepare-and-deploy.ipynb notebook. You run the cells in the notebook to perform the following tasks:
- Download and run the ResNet model from TensorFlow Hub.
- Create serving signatures for the model.
- Export the model as a SavedModel.
- Deploy the SavedModel to AI Platform Prediction.
- Validate the deployed model.
The next sections in this document provide details about preparing the ResNet model and about deploying it.
Prepare the ResNet model for deployment
The ResNet model from TensorFlow Hub has no serving signatures because it’s optimized for recomposition and fine tuning. Therefore, you need to create serving signatures for the model so that it can serve the model for online predictions.
In addition, for serving the model, we recommend that you embed the feature-engineering logic into the serving interface. Doing this guarantees the affinity between the preprocessing and the model serving, instead of depending on the client application to preprocess data in the required format. You must also include post-processing in the serving interface, such as converting a class ID to a class label.
To make the ResNet model servable, you need to implement serving signatures that describe the inference methods of the model. Therefore, the notebook code adds two signatures:
- The default signature. This signature exposes the default
predictmethod of the ResNet V2 101 model; the default method has no preprocessing or post-processing logic. - Preprocessing and post-processing signature. The expected inputs to this interface require relatively complex preprocessing, including encoding, scaling, and normalizing the image. Therefore, the model also exposes an alternative signature that embeds the preprocessing and post-processing logic. This signature accepts raw unprocessed images and returns the list of ranked class labels and the associated label probabilities.
The signatures are created in a custom module class. The class is derived from the tf.Module base class that encapsulates the ResNet model. The custom class extends the base class with a method that implements the image preprocessing and output post-processing logic. The default method of the custom module is mapped to the default method of the base ResNet model to maintain the analogous interface. The custom module is exported as a SavedModel that includes the original model, the preprocessing logic, and two serving signatures.
The implementation of the custom module class is shown in the following code snippet:
LABELS_KEY = 'labels'
PROBABILITIES_KEY = 'probabilities'
NUM_LABELS = 5

class ServingModule(tf.Module):
    """
    A custom tf.Module that adds image preprocessing and output post processing to
    a base TF 2 image classification model from TensorFlow Hub.
    """

    def __init__(self, base_model, input_size, output_labels):
        super(ServingModule, self).__init__()
        self._model = base_model
        self._input_size = input_size
        self._output_labels = tf.constant(output_labels, dtype=tf.string)

    def _decode_and_scale(self, raw_image):
        """
        Decodes, crops, and resizes a single raw image.
        """

        image = tf.image.decode_image(raw_image, dtype=tf.dtypes.uint8, expand_animations=False)
        image_shape = tf.shape(image)
        image_height = image_shape[0]
        image_width = image_shape[1]
        crop_size = tf.minimum(image_height, image_width)
        offset_height = ((image_height - crop_size) + 1) // 2
        offset_width = ((image_width - crop_size) + 1) // 2

        image = tf.image.crop_to_bounding_box(image, offset_height, offset_width, crop_size, crop_size)
        image = tf.image.resize(image, [self._input_size, self._input_size])
        image = tf.cast(image, tf.uint8)

        return image

    def _preprocess(self, raw_inputs):
        """
        Preprocesses raw inputs as sent by the client.
        """

        # A mitigation for https://github.com/tensorflow/tensorflow/issues/28007
        with tf.device('/cpu:0'):
            images = tf.map_fn(self._decode_and_scale, raw_inputs, dtype=tf.uint8)
        images = tf.image.convert_image_dtype(images, tf.float32)

        return images

    def _postprocess(self, model_outputs):
        """
        Postprocess outputs returned by the base model.
        """

        probabilities = tf.nn.softmax(model_outputs)
        indices = tf.argsort(probabilities, axis=1, direction='DESCENDING')

        return {
            LABELS_KEY: tf.gather(self._output_labels, indices, axis=-1)[:,:NUM_LABELS],
            PROBABILITIES_KEY: tf.sort(probabilities, direction='DESCENDING')[:,:NUM_LABELS]
        }

    @tf.function(input_signature=[tf.TensorSpec([None, 224, 224, 3], tf.float32)])
    def __call__(self, x):
        """
        A pass-through to the base model.
        """

        return self._model(x)

    @tf.function(input_signature=[tf.TensorSpec([None], tf.string)])
    def predict_labels(self, raw_images):
        """
        Preprocesses inputs, calls the base model
        and postprocess outputs from the base model.
        """

        # Call the preprocessing handler
        images = self._preprocess(raw_images)

        # Call the base model
        logits = self._model(images)

        # Call the postprocessing handler
        outputs = self._postprocess(logits)

        return outputs

serving_module = ServingModule(model, 224, imagenet_labels)
The following code snippet shows how the model is exported as a SavedModel with the serving signatures that were defined earlier:
...

default_signature = serving_module.__call__.get_concrete_function()
preprocess_signature = serving_module.predict_labels.get_concrete_function()
signatures = {
    'serving_default': default_signature,
    'serving_preprocess': preprocess_signature
}

tf.saved_model.save(serving_module, model_path, signatures=signatures)
Deploy the model to AI Platform Prediction
When the model is exported as a SavedModel, the following tasks are performed:
- The model is uploaded to Cloud Storage.
- A model object is created in AI Platform Prediction.
- A model version is created for the SavedModel.
The following code snippet from the notebook shows the commands that perform these tasks.
gsutil cp -r {model_path} {GCS_MODEL_LOCATION}

gcloud ai-platform models create {MODEL_NAME} \
    --project {PROJECT_ID} \
    --regions {REGION}

MACHINE_TYPE='n1-standard-8'
ACCELERATOR='count=1,type=nvidia-tesla-p4'

gcloud beta ai-platform versions create {MODEL_VERSION} \
    --model={MODEL_NAME} \
    --origin={GCS_MODEL_LOCATION} \
    --runtime-version=2.1 \
    --framework=TENSORFLOW \
    --python-version=3.7 \
    --machine-type={MACHINE_TYPE} \
    --accelerator={ACCELERATOR} \
    --project={PROJECT_ID}
The command creates an n1-standard-8 machine type for the model prediction service along with a nvidia-tesla-p4 GPU accelerator.
After you run the notebook cells that have these commands, you can verify that the model version is deployed by viewing it in the AI Platform Models page of the Cloud Console. The output is similar to the following: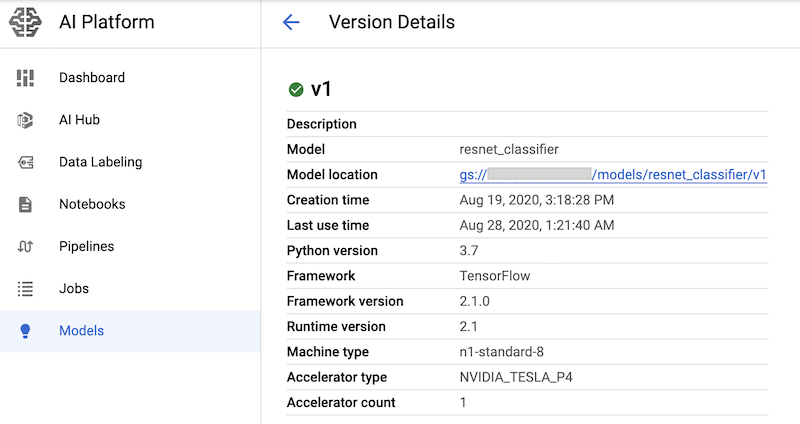
Creating Cloud Monitoring metrics
After the model has been set up for serving, you can configure metrics that let you monitor serving performance. The code for configuring the metrics is in the 02-perf-testing.ipynb notebook.
The first part of the 02-perf-testing.ipynb notebook creates custom logs-based metrics in Cloud Monitoring using the Python Cloud Logging SDK. The metrics are based on the log entries that are generated by the Locust task. The log_stats method writes the log entries into a Cloud Logging log named locust.
Each log entry includes a set of key-value pairs in JSON format, as listed in the following table. The metrics are based on the subset of keys from the log entry.
| Key | Value description | Usage |
|---|---|---|
test_id |
The ID of a test | Filtering attributes |
model |
The AI Platform Prediction model name | |
model_version |
The AI Platform Prediction model version | |
latency |
The 95th percentile response time, which is calculated over a 10-second sliding window | Metric values |
num_requests |
The total number of requests since the test started | |
num_failures |
The total number of failures since the test started | |
user_count |
The number of simulated users | |
rps |
The requests per second |
The following code snippet shows the create_locust_metric function in the notebook that creates a custom logs-based metric.
def create_locust_metric(
    metric_name:str,
    log_path:str,
    value_field:str,
    bucket_bounds:List[int]):

    metric_path = logging_client.metric_path(PROJECT_ID, metric_name)
    log_entry_filter = 'resource.type=global AND logName={}'.format(log_path)

    metric_descriptor = {
        'metric_kind': 'DELTA',
        'value_type': 'DISTRIBUTION',
        'labels': [{'key': 'test_id', 'value_type': 'STRING'},
                   {'key': 'signature', 'value_type': 'STRING'}]}

    bucket_options = {
        'explicit_buckets': {'bounds': bucket_bounds}}

    value_extractor = 'EXTRACT(jsonPayload.{})'.format(value_field)
    label_extractors = {
        'test_id': 'EXTRACT(jsonPayload.test_id)',
        'signature': 'EXTRACT(jsonPayload.signature)'}

    metric = logging_v2.types.LogMetric(
        name=metric_name,
        filter=log_entry_filter,
        value_extractor=value_extractor,
        bucket_options=bucket_options,
        label_extractors=label_extractors,
        metric_descriptor=metric_descriptor,
    )

    try:
        logging_client.get_log_metric(metric_path)
        print('Metric: {} already exists'.format(metric_path))
    except:
        logging_client.create_log_metric(parent, metric)
        print('Created metric {}'.format(metric_path))
The following code snippet shows how the create_locust_metric method is invoked in the notebook to create the four custom Locust metrics that are shown in the earlier table.
# user count metric
metric_name = 'locust_users'
value_field = 'user_count'
bucket_bounds = [1, 16, 32, 64, 128]

create_locust_metric(metric_name, log_path, value_field, bucket_bounds)

# latency metric
metric_name = 'locust_latency'
value_field = 'latency'
bucket_bounds = [1, 50, 100, 200, 500]

create_locust_metric(metric_name, log_path, value_field, bucket_bounds)

# failure count metric
metric_name = 'num_failures'
value_field = 'num_failures'
bucket_bounds = [1, 1000]

create_locust_metric(metric_name, log_path, value_field, bucket_bounds)

# request count metric
metric_name = 'num_requests'
value_field = 'num_requests'
bucket_bounds = [1, 1000]

create_locust_metric(metric_name, log_path, value_field, bucket_bounds)
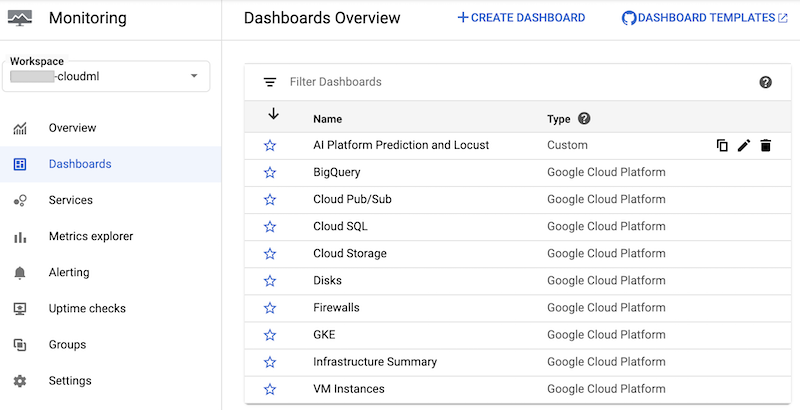
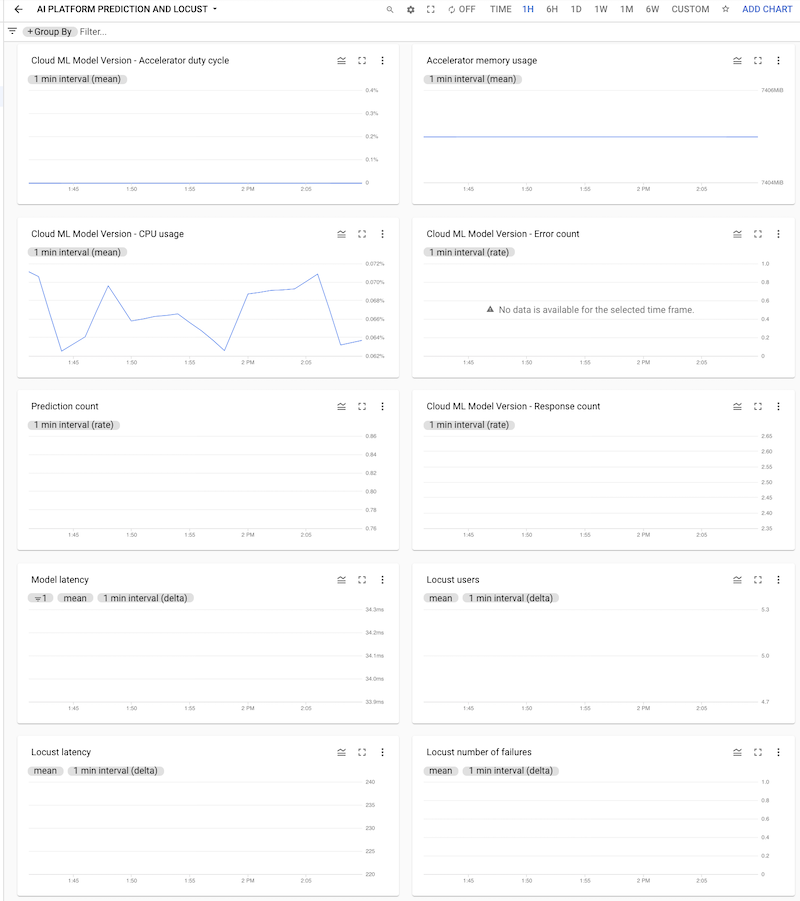
The notebook creates a custom Cloud Monitoring dashboard called AI Platform Prediction and Locust. The dashboard combines the standard AI Platform Prediction metrics and the custom metrics that are created based on the Locust logs.
For more information, see the Cloud Logging API documentation.
This dashboard and its charts can be created manually. However, the notebook provides a programmatic way to create it by using the monitoring-template.json JSON template. The code uses the DashboardsServiceClient class to load the JSON template and create the dashboard in Cloud Monitoring, as shown in the following code snippet:
parent = 'projects/{}'.format(PROJECT_ID)

dashboard_template_file = 'monitoring-template.json'
with open(dashboard_template_file) as f:
    dashboard_template = json.load(f)

dashboard_proto = Dashboard()
dashboard_proto = ParseDict(dashboard_template, dashboard_proto)
dashboard = dashboard_service_client.create_dashboard(parent, dashboard_proto)
After the dashboard is created, you can see it in the list of Cloud Monitoring dashboards in the Cloud Console:
You can click the dashboard to open it and see the charts. Each chart displays a metric either from AI Platform Prediction or from the Locust logs, as shown in the following screenshots.
Deploying the Locust test to the GKE cluster
Before you deploy the Locust system to GKE, you need to build the Docker container image that contains the test logic that’s built into the task.py file. The image is derived from the baseline locust.io image and is used for the Locust master and worker Pods.
The logic for building and deploying is in the notebook under 3. Deploying Locust to a GKE cluster. The image is built using the following code:
image_uri = 'gcr.io/{}/locust'.format(PROJECT_ID)

!gcloud builds submit --tag {image_uri} locust/locust-image
The deployment process described in the notebook has been defined using Kustomize. The Locust Kustomize deployment manifests define the following files that define components:
locust-master. This file defines a deployment that hosts a web interface where you start the test and see live statistics.locust-worker. This file defines a deployment that runs a task to load-test your ML model prediction service. Typically, multiple workers are created to simulate the effect of multiple simultaneous users making calls to your prediction service API.locust-worker-service. This file defines a service that accesses the web interface inlocust-masterthrough an HTTP load balancer.
You need to update the default manifest before the cluster is deployed. The default manifest consists of the kustomization.yaml and patch.yaml files; you must make changes in both files.
In the kustomization.yaml file, do the following:
- Set the name of the custom Locust image. Set the
newNamefield in theimagessection to the name of the custom image that you built earlier. - Optionally, set the number of worker Pods. The default configuration deploys 32 worker Pods. To change the number, modify the
countfield in thereplicassection. Make sure that your GKE cluster has a sufficient number of CPUs for the Locust workers. - Set the Cloud Storage bucket for the test configuration and payload files. In the
configMapGeneratorsection, make sure that the following are set:LOCUST_TEST_BUCKET. Set this to the name of the Cloud Storage bucket that you created earlier.LOCUST_TEST_CONFIG. Set this to the test config file name. In the YAML file, this is set totest-config.json, but you can change this if you want to use a different name.LOCUST_TEST_PAYLOAD. Set this to the test payload file name. In the YAML file, this is set totest-payload.json, but you can change this if you want to use a different name.
In the patch.yaml file, do the following:
- Optionally, modify the node pool that hosts the Locust master and workers. If you deploy the Locust workload to a node pool other than
default-pool, find thematchExpressionssection, and then undervalues, update the name of the node pool that the Locust workload will be deployed to.
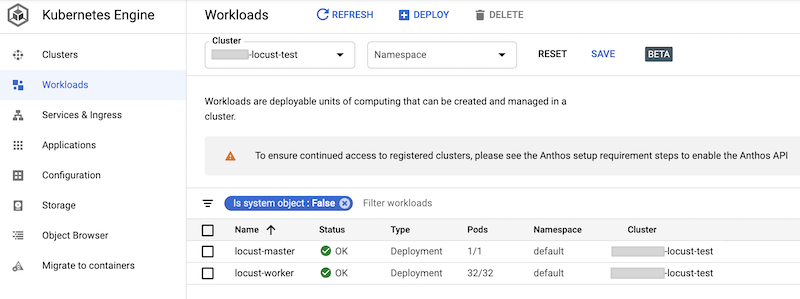
After you’ve made these changes, you can build your customizations into the Kustomize manifests and apply the Locust deployment (locust-master, locust-worker, and locust-master-service) to the GKE cluster. The following command in the notebook performs these tasks:
!kustomize build locust/manifests | kubectl apply -f -
You can check the deployed workloads in the Cloud Console. The output is similar to the following:
Implementing the Locust load test
The test task for Locust is to call the model that’s deployed to AI Platform Prediction.
This task is implemented in the AIPPClient class in the task.py module that’s in the /locust/locust-image/ folder. The following code snippet shows the class implementation.
class AIPPClient(object):
   """
   A convenience wrapper around AI Platform Prediction REST API.
   """

   def __init__(self, service_endpoint):
       logging.info(
         "Setting the AI Platform Prediction service endpoint: {}".format(service_endpoint))
       credentials, _ = google.auth.default()
       self._authed_session = AuthorizedSession(credentials)
       self._service_endpoint = service_endpoint

   def predict(self, project_id, model, version, signature, instances):
       """
       Invokes the predict method on the specified signature.
       """

       url = '{}/v1/projects/{}/models/{}/versions/{}:predict'.format(
           self._service_endpoint, project_id, model, version)

       request_body = {
           'signature_name': signature,
           'instances': instances
       }

       response = self._authed_session.post(url, data=json.dumps(request_body))
       return response
The AIPPUser class in the task.py file inherits from locust.User class to simulate user behavior of calling the AI Platform Prediction model. This behavior is implemented in the predict_task method. The on_start method of the AIPPUser class downloads the following files from a Cloud Storage bucket that’s specified in the LOCUST_TEST_BUCKET variable in the task.py file:
test-config.json. This JSON file includes the following configurations for the test:test_id,project_id,model, andversion.test-payload.json. This JSON file includes the data instances in the format that’s expected by AI Platform Prediction, along with the target signature.
The code for preparing the test data and test configuration is included in the 02-perf-testing.ipynb notebook under 4. Configure a Locust test.
The test configurations and data instances are used as parameters for the predict method in the AIPPClient class to test the target model using the required test data. The AIPPUser simulates a wait time of 1 to 2 seconds between calls from a single user.
Running the Locust test
After you run the notebook cells to deploy the Locust workload to the GKE cluster, and after you’ve created and then uploaded the test-config.json and test-payload.json files to Cloud Storage, you can start, stop, and configure a new Locust load test by using its web interface. The code in the notebook retrieves the URL of the external load balancer that exposes the web interface by using the following command:
%%bash
IP_ADDRESS=$(kubectl get service locust-master | awk -v  col=4 'FNR==2{print $col}')
echo http://$IP_ADDRESS:8089
To perform the test, do the following:
- In a browser, enter the URL that you retrieved.
- To simulate your test workload using different configurations, enter values into the Locust interface, which is similar to the following:
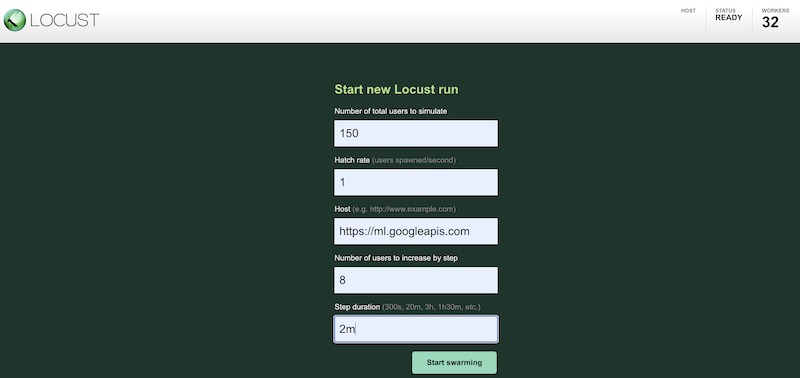 The preceding screenshot shows the following configuration values:
- Number of total users to simulate:
150 - Hatch rate:
1 - Host:
- Number of users to increase by step:
10 - Step duration:
2m
- Number of total users to simulate:
As the test runs, you can monitor the test by examining Locust charts. The following screenshots show how values are displayed.
One chart shows the total number of requests per second:

Another chart shows the response time in milliseconds:

As mentioned earlier, these statistics are also logged to Cloud Logging so that you can create custom Cloud Monitoring logs-based metrics.
Collecting and analyzing the test results
The next task is to collect and analyze the Cloud Monitoring metrics that are computed from the results logs as a pandas DataFrame object so that you can visualize and analyze the results in the notebook. The code to perform this task is in the 03-analyze-results.ipynb notebook.
The code uses the Cloud Monitoring Query Python SDK to filter and retrieve the metric values, given values that are passed in the project_id, test_id, start_time, end_time, model, model_version, and log_name parameters.
The following code snippet shows the methods that retrieve AI Platform Prediction metrics and the custom Locust logs-based metrics.
import pandas as pd
from google.cloud.monitoring_v3.query import Query

def _get_aipp_metric(metric_type: str, labels: List[str]=[], metric_name=None)-> pd.DataFrame:
    """
    Retrieves a specified AIPP metric.
    """
    query = Query(client, project_id, metric_type=metric_type)
    query = query.select_interval(end_time, start_time)
    query = query.select_resources(model_id=model)
    query = query.select_resources(version_id=model_version)

    if metric_name:
        labels = ['metric'] + labels
    df = query.as_dataframe(labels=labels)

    if not df.empty:
        if metric_name:
            df.columns.set_levels([metric_name], level=0, inplace=True)
        df = df.set_index(df.index.round('T'))
        return df

def _get_locust_metric(metric_type: str, labels: List[str]=[],
                       metric_name=None)-> pd.DataFrame:
    """
     Retrieves a specified custom logs-based metric.
     """
     query = Query(client, project_id, metric_type=metric_type)
     query = query.select_interval(end_time, start_time)
     query = query.select_metrics(log=log_name)
     query = query.select_metrics(test_id=test_id)

     if metric_name:
         labels = ['metric'] + labels
     df = query.as_dataframe(labels=labels)

     if not df.empty:
        if metric_name:
            df.columns.set_levels([metric_name], level=0, inplace=True)
        df = df.apply(lambda row: [metric.mean for metric in row])
        df = df.set_index(df.index.round('T'))

     return df
The metrics data is retrieved as a pandas DataFrame object for each metric; the individual data frames are then merged into a single DataFrame object. The final DataFrame object with the merged results looks like the following in your notebook:
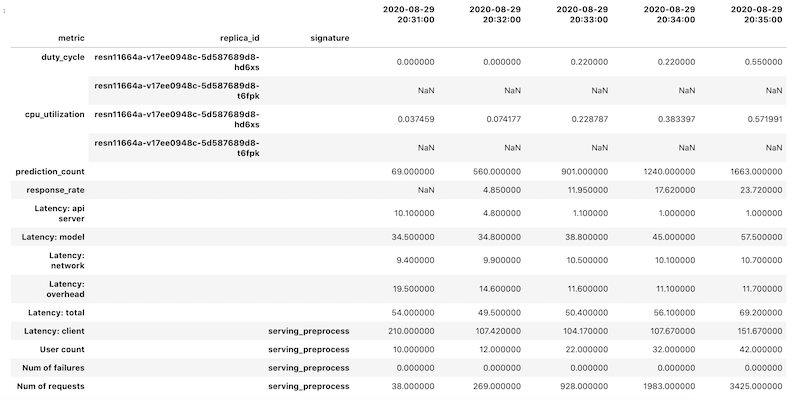
The retrieved DataFrame object uses hierarchical indexing for column names. The reason is that some metrics contain multiple time series. For example, the GPU duty_cycle metric includes a time series of measures for each GPU that’s used in the deployment, indicated as replica_id. The top level of the column index shows the name for an individual metric. The second level is a replica ID. The third level shows the signature of a model. All metrics are aligned on the same timeline.
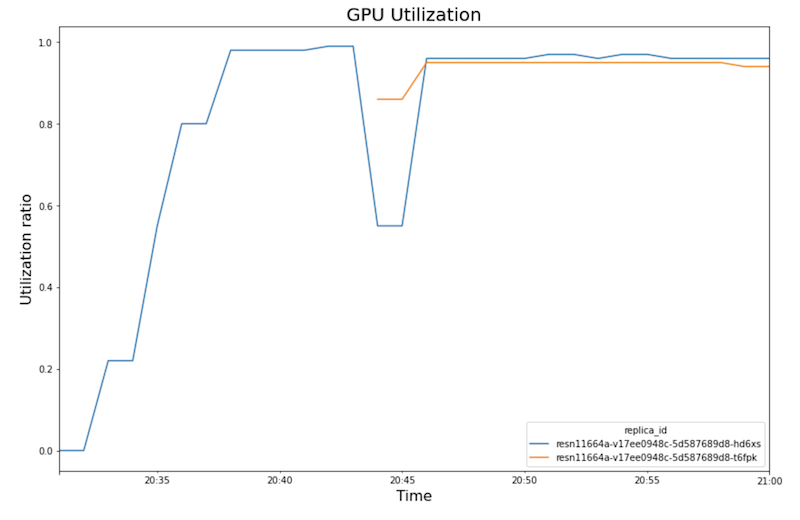
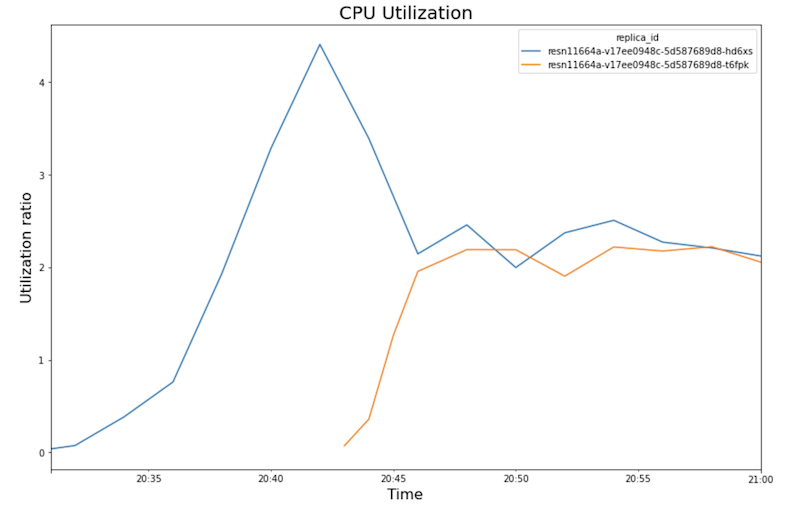
The following charts show GPU utilization, CPU utilization, and latency as you see them in the notebook.
GPU utilization:
CPU utilization:
Latency:
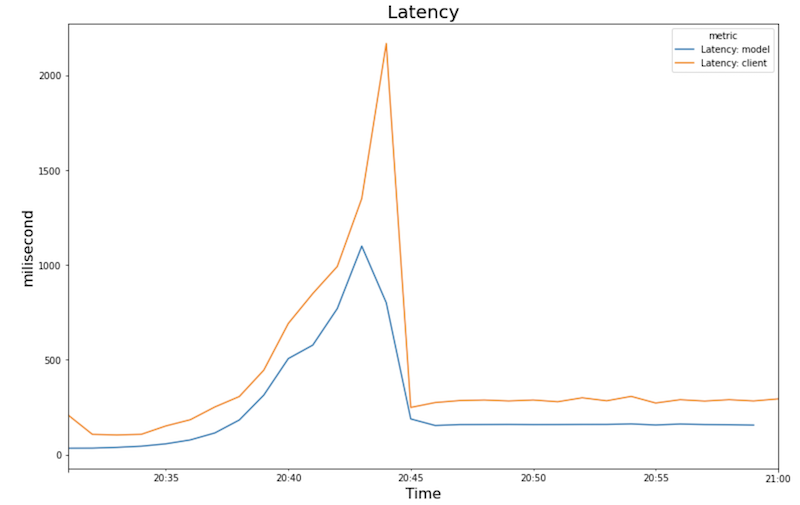
The charts shows the following behavior and sequence:
- As the workload (number of users) increases, CPU and GPU utilization increase. As a result, latency increases, and the difference between the model latency and the total latency increases until it peaks around time 20:40.
- At 20:40, GPU utilization reaches 100% while the CPU chart shows that utilization reaches 4 CPUs. The sample uses an
n1-standard-8machine in this test, which has 8 CPUs. Thus the CPU utilization reaches 50%. - At this point, autoscaling adds capacity: a new serving node is added with an additional GPU replica. The first GPU replica utilization decreases, and the second GPU replica utilization increases.
- Latency decreases as the new replica starts to serve predictions, converging at around 200 milliseconds.
- CPU utilization converges at around 250% for each replica—that is, utilizing 2.5 CPUs out of 8 CPUs. This value indicates that you could use an
n1-standard-4machine instead of ann1-standard-8machine.
Cleaning up
To avoid incurring charges to your Google Cloud for the resources used in this document, either delete the project that contains the resources, or keep the project and delete the individual resources.
- In the Cloud Console, go to the Manage resources page.Go to Manage resources
- In the project list, select the project that you want to delete, and then click Delete.
- In the dialog, type the project ID, and then click Shut down to delete the project.
If you want to keep the Cloud project but delete the resources that you created, delete the Google Kubernetes Engine cluster and the deployed AI Platform model.
This article has been published from the source link without modifications to the text. Only the headline has been changed.


