Finding the locations and optimal number of DC’s required in the USA for distribution of the COVID-19 vaccine
Background
Everyone here must have heard of Amazon and its growth in recent years. One of the main reasons for the success of Amazon is its supply chain management. All the people who have ordered at least once from Amazon should be familiar with their popular 1-day shipping. Ever wondered how companies like Amazon can deliver products so quickly to any location in the USA?
This is not a simple task to achieve considering the vast magnitude of land in the USA and the number of orders they receive each day from all corners of the country. Turns out, most of the products you order are directly shipping from your state not from somewhere else. All companies like Walmart, Amazon store surplus products which customers don’t need immediately in the distribution centers based on the anticipation of customer demand.
All the services such as product mixing, order fulfillment, cross-docking, packaging are done in distribution centers. These DC’s are located in a way they can be used to deliver goods to the maximum area possible in the shortest time. For any company to become successful an effective supply chain strategy is a must and DC’s play a crucial role in the supply chain strategy.
The Problem
The total COVID 19 cases count has passed 7 million mark on 24th September in the USA. On the other hand, many countries like the UK are claiming that their COVID -19 vaccine development is in the final stages and will be released by the end of 2020. I thought it will be interesting to find out when the vaccine is finally released how will be distributed across all the hospitals including clinical centres which are treating COVID-19 patients in the USA. If at all the US government is planning to make use of Distribution Center’s to supply vaccination to all hospitals treating COVID-19 patients, Where should the DC’s be located? How many DC’s are needed?
First I started with some web scrapping from Wikipedia to get the list of all hospitals in the USA with there Address and County Name. And matched the county name of the hospital regions with the active COVID-19 cases in that region. To make it easier for plotting and finding distance I found latitudes and longitudes for all the addresses using geocoding, for which I clearly explained steps in my previous blog.
The glimpse of data set after finding latitudes and longitudes for all the hospitals
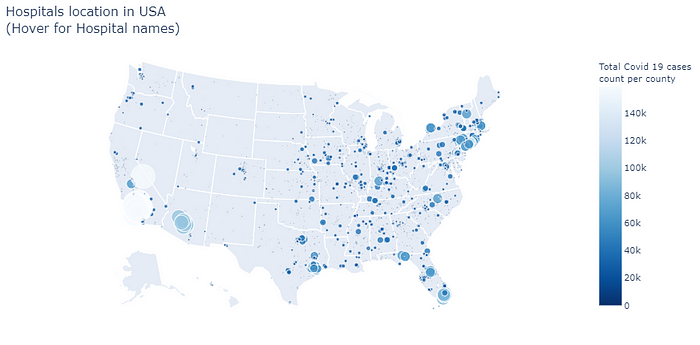
Fig 1. USA hospitals location DataNow that we have latitudes and longitudes, it is very easy to plot them. The image below represents the locations of all the hospitals in the USA with active COVID-19 cases generated using folium maps in python.

Here, the points with bigger circles represent the regions with more COVID-19 active cases. It can be clearly seen that some regions in California have the highest number of active cases. Back to our problem, where we are trying to find the optimal locations for Distribution Centers to supply vaccines to all hospitals. Here, determining DC’s location for specific hospitals is similar to dividing all the hospitals into different clusters and locating one centroid point for each cluster of hospitals. This situation is very similar to the K-Means clustering algorithm, Therefore K-Means clustering can be applied to this case.
How (Standard) K-Means Clustering works?
K-Means clustering is a popular unsupervised ML algorithm used for partitioning data into K clusters. The algorithm works iteratively to assign each data point to one of the K groups. The data is randomly divided into K groups with mean centroid point assigned to each group and the algorithm iterates to find:
- The distance between all the data points to the centroid points and forms new clusters by reassigning the data points to its nearest centroid.
- Again new centroid points are found by taking the mean of distances
This process is iterated repeatedly until the Sum of Squared distances are minimized or the predefined limit is reached.
An important step to be performed before starting the k-means is to decide on the number of clusters. The number of K is a predefined hyperparameter that should be tuned to get an optimal result. This can be done using the elbow method which will be briefly explained later in the article.
This is a versatile algorithm that can be used for any type of grouping. Some examples of use cases are Grouping Inventory based on demand or customer segmentation based on purchases.
Problem Solving:
The only problem we have here is more preference should be given to the locations with more active COVID-19 cases. This is where Weighted K-Means Clustering comes in to play.
The standard K-means approach would not work because it fails to consider the fact that some regions where hospitals are located have more active COVID-19 cases, which implies having a higher volume demand for the vaccine to be supplied.
How Weighted K-Means differs from Standard K-Means?
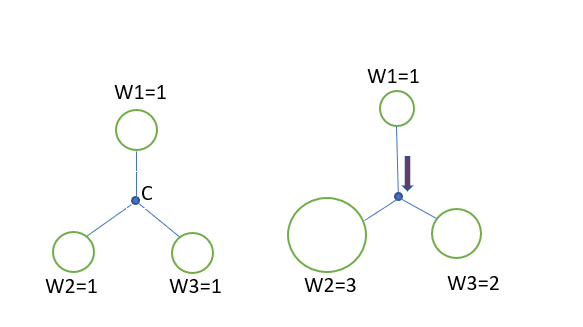
The weighted K-Means work the same as standard K-Means clustering. The only difference would be instead of just calculating centroid points based on the mean of distances, the weighted average should be used. Thus, the bigger the weight of the data point the nearer centroid will be pulled. The image below shows the illustration of Standard K-Means vs weighted K-Means. Here, in the right image, the weight of data points is higher for W2 and W3. So, the centroid is pulled them instead of being located in the center.

The weighted can be given to any variable we want from the dataset like urban cities or total populations of the city. In our case, the weightage will be given to the total active COVID-19 cases per county. So they should be given more preference.
One more problem is in our case we cannot use traditional Euclidean distance as a distance metric to find centroid points because, we have latitudes and longitudes which represent earth spherical dimensions as opposed to 2D (x,y) coordinates in euclidean distances. There are many options available to calculate the distance between two spherical points like Haversine distance or Great circle distance. We will be using Haversine distance.
Haversine Distance
The haversine distance d can be found using the following formulae, where φ represents latitudes and λ represents longitudes.
a = sin²(( φB — φA) /2) + cos φA * cos φB * sin²((λB — λA) /2)
c = 2 * atan2( √a, √(1−a) )
d = R ⋅ c (R = Radius of earth, i.e, 6,371 KM)
Luckily, We don’t need to use all these formulae to calculate haversine distance because in python there is a library named haversine which directly calculates the distance between location coordinates with one line of code
from haversine import haversine
haversine((31.215827,-85.363433),(28.703230,-81.815668))
Using Weighted K-Means with Haversine distance as distance metric a modified Weighted K-Means algorithm is created which can be found in my Github repository.
Now, Finally, we need to determine the optimal number of distribution centers, to better fulfill the demand and minimize delivery expenses. i.e, the optimal number of K. This can be determined using the Elbow method.
Elbow Method
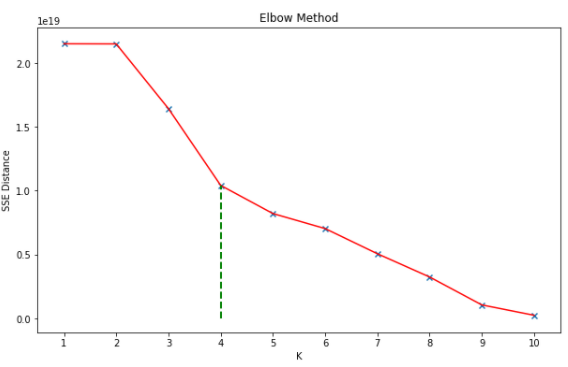
In cluster analysis, the elbow method is a heuristic used in determining the optimal number of clusters in a data set. The Within-Cluster-Sum of Squared Errors (SSE) for different values of ‘k’ is calculated and for whichever ‘k’ value the WSS becomes first starts to diminish, that particular ‘k’ is chosen. Typically, the K value where it forms an elbow shape is considered as an optimal value. The SSE is nothing but the sum of squares of the distances of each data point in all clusters to their respective centroids. The below plot represents the SSE vs the number of clusters for our data. Since the decrease in SSE value is no longer significant after 4 clusters. The K=4 can be considered as our optimum K-Value.

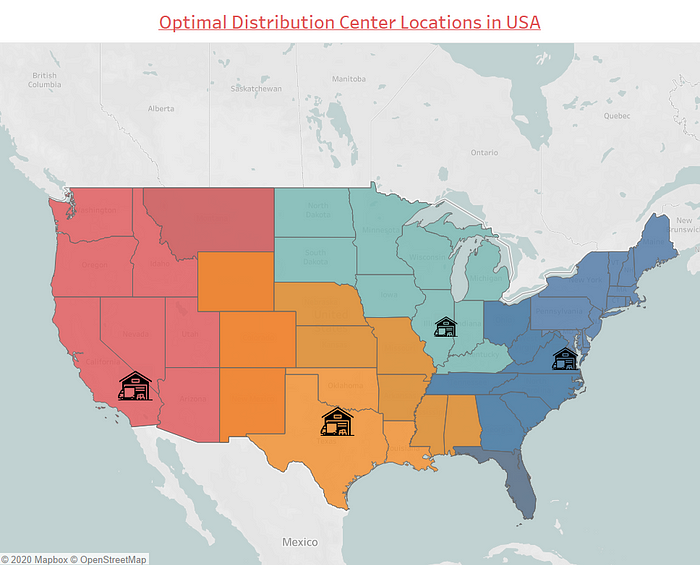
Finally, we found that 4 is the optimal number of Distribution Centers required. After implementing our algorithm with 4 clusters the location of DC’s found are shown below:

The recommended DC locations found after implementing the algorithm are:
- Riverside, California
- Dallas, Texas
- Urbana, Illinois
- Petersburg, Virginia.
Conclusion
In this article, an application of the weighted K-means clustering algorithm to determine optimal Distribution locations is demonstrated. To summarize, in this modified K-Means clustering the centroids are calculated by considering the weighted average instead of mean and haversine distance is used instead of euclidean distance.
This article has been pubished from the source link without modifications to the text. Only the headline has been changed.


