When working with Java or any other JVM-based programming language we get certain functionalities for free. One of those functionalities is clearing the memory. If you’ve ever used languages like C/C++ you probably remember functions like malloc, calloc, realloc and free. We needed to take care of the assignment of each byte in memory and take care of releasing the assigned memory when it was no longer needed. Without that, we were soon running into a shortage of memory leading to instability and crashes.
With Java, we don’t have to worry about releasing the memory that was assigned to an object. We only need to stop using the object. It’s as simple as that. Once the object is no longer referenced from inside our code the memory can be released and re-used again.
Freeing memory is done by a specialized part of the JVM called Garbage Collector.
How Does the Java Garbage Collector Work
The Java Virtual Machine runs the Garbage Collector in the background to find references that are not used. Memory used by such references can be freed and re-used. You can already see the difference compared to languages like C/C++. You don’t have to mark the object for deletion, it is enough to stop using it.
The heap memory is also divided into different regions and each has its own garbage collector type. There are a few implementations of the garbage collector – and each JVM can have its own implementation as long as it meets the specification. In theory and practice, each JVM vendor can provide its own garbage collector implementation providing different performance.
The simplified view over the three main regions of the JVM Heap can be visualized as follows:
Having a healthy garbage collection process is crucial to achieving optimal performance of your JVM based applications. Because of that, we need to ensure that we monitor JVM and its Garbage Collector. By using logs we can understand what the JVM tells us about the garbage collectors’ work.
What Are Garbage Collection (GC) Logs
The garbage collector log is a text file produced by the Java Virtual Machine that describes the work of the garbage collector. It contains all the information you could need to see how the memory cleaning process works. It also shows how the garbage collector behaves and how much resources it uses. Though we can monitor our application using an APM provider or in-house built monitoring tool, the garbage collector log will be invaluable to quickly identify any potential issues and bottlenecks when it comes to heap memory utilization.
An example of what you can expect to find in the garbage collection log look as follows:
2019-10-29T10:00:28.693-0100: 0.302: [GC (Allocation Failure) 2019-10-29T10:00:28.693-0100: 0.302: [ParNew
Desired survivor size 1114112 bytes, new threshold 1 (max 6)
- age   1:    2184256 bytes,    2184256 total
: 17472K->2175K(19648K), 0.0011358 secs] 17472K->2382K(63360K), 0.0012071 secs] [Times: user=0.01 sys=0.00, real=0.00 secs]
2019-10-29T10:00:28.694-0100: 0.303: Total time for which application threads were stopped: 0.0012996 seconds, Stopping threads took: 0.0000088 seconds
2019-10-29T10:00:28.879-0100: 0.488: Total time for which application threads were stopped: 0.0001006 seconds, Stopping threads took: 0.0000065 seconds
2019-10-29T10:00:28.897-0100: 0.506: Total time for which application threads were stopped: 0.0000981 seconds, Stopping threads took: 0.0000076 seconds
2019-10-29T10:00:28.910-0100: 0.519: Total time for which application threads were stopped: 0.0000896 seconds, Stopping threads took: 0.0000062 seconds
2019-10-29T10:00:28.923-0100: 0.531: Total time for which application threads were stopped: 0.0000975 seconds, Stopping threads took: 0.0000069 seconds
2019-10-29T10:00:28.976-0100: 0.585: Total time for which application threads were stopped: 0.0001414 seconds, Stopping threads took: 0.0000091 seconds
2019-10-29T10:00:28.982-0100: 0.590: [GC (Allocation Failure) 2019-10-29T10:00:28.982-0100: 0.590: [ParNew
Desired survivor size 1114112 bytes, new threshold 1 (max 6)
- age   1:    1669448 bytes,    1669448 total
: 19647K->2176K(19648K), 0.0032520 secs] 19854K->5036K(63360K), 0.0033060 secs] [Times: user=0.03 sys=0.00, real=0.00 secs]
Even a very small period of time can provide a lot of information. You see allocation failures, young garbage collection, threads being stopped, memory before and after garbage collection, each event leading to the promotion of the objects inside the heap memory.

Why Are Garbage Collection Logs Important
Dealing with application performance tuning can be a long and unpleasant experience. We need to properly prepare the environment and observe the application. Check this out to learn more about JVM performance tuning. With the right observability tool, like our Sematext Cloud, you get insights into crucial metrics related to the application, the JVM and the operating system.
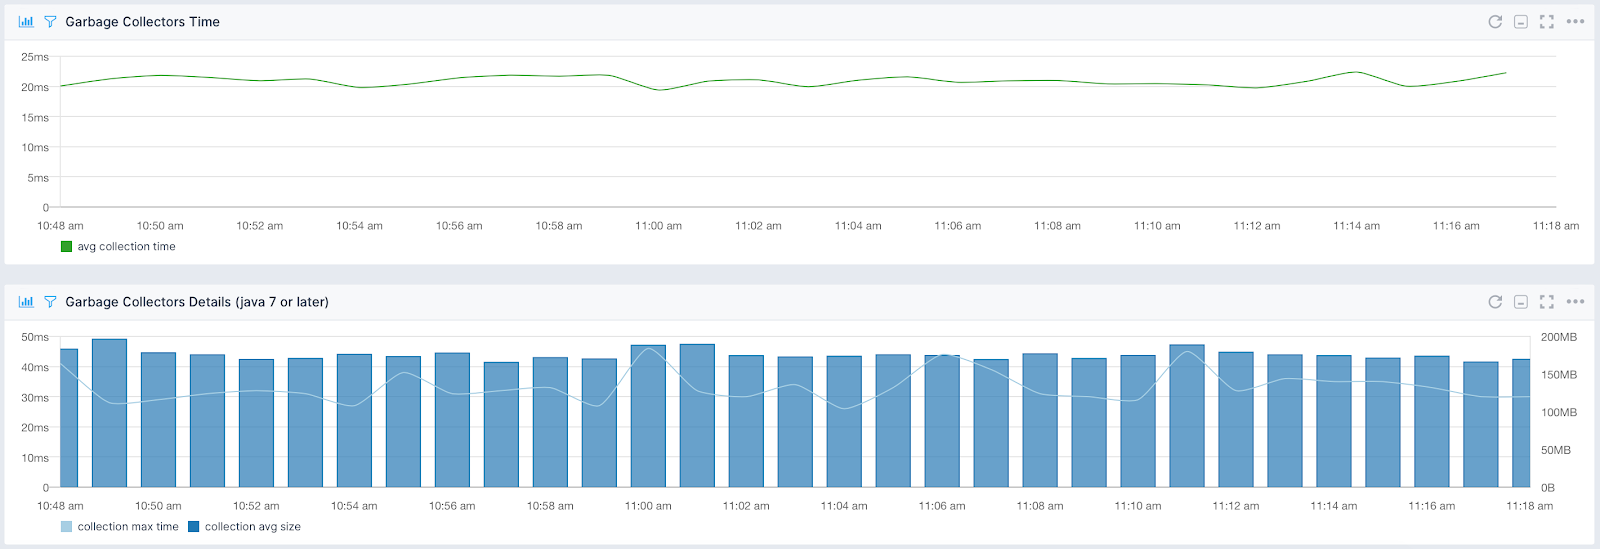
Metrics are not everything though. Even the best APM tools will not give you everything. Metrics can show you patterns and historical data that will help you identify potential issues, but to be able to see everything you will need to dig deeper. That deeper level in terms of a Java-based application is the garbage collection log. Even though GC logs are very verbose, they provide information that’s not available in other sources, like stop the world events and how long they took, how long the application threads were stopped, memory pool utilization and many, many more.
How to Enable GC Logging
Before talking about how to enable garbage collector logging we should ask ourselves one thing. Should I turn on the logs by default or I should only turn them on when issues start appearing? On modern devices, you shouldn’t worry about performance when enabling the garbage collector logs. Of course, you will experience a bit more writing to your persistent storage just because the logs have to be written somewhere. Apart from that, the logs shouldn’t produce any additional load on the system.
You should always have the Java garbage collection logs turned on. In fact, a lot of open-source systems are already following that practice. For example, search systems like Apache Solr or Elasticsearch are already including JVM flags that turn on the logs. We already know that those files include crucial information about the Java Virtual Machine operations so we know why we should have it turned on.
There is a difference in terms of how you activate garbage collection logging for Java 8 and earlier and for the newer Java versions.
For Java 8 and earlier you should add the following flags to your JVM based application startup parameters:
-XX:+PrintGCDetails -Xloggc:<PATH_TO_GC_LOG_FILE>Where the PATH_TO_GC_LOG_FILE is the location of the garbage collector log file. For example:
java -XX:+PrintGCDetails -Xloggc:/var/log/myapp/gc.log -jar my_awesome_app.jarIn some cases, you can also see that the -XX:+PrintGCTimeStamps is included. However, it is redundant here and not needed.
For Java 9 and newer you can simplify the command above and add the following flag to the application startup parameters:
-Xlog:gc*:file=<PATH_TO_GC_LOG_FILE>For example:
java -Xlog:gc*:file=/var/log/myapp/gc.log -jar my_awesome_app.jarOnce you enable the logs it’s important to remember the GC logs rotation. When using an older JVM version, like JDK 8 you may want to rotate your GC logs. To do that we have three flags that we can add to our JVM application startup parameters. The first one is the flag that enables GC logs rotation: -XX:+UseGCLogFileRotation. The second property -XX:NumberOfGCLogFiles tells the JVM how many GC log files should be kept. For example including -XX:NumberOfGCLogFiles=10 will enable up to 10 GC log files. Finally the -XX:GCLogFileSize tells how large a single GC log file can be. For example -XX:GCLogFileSize=10m will rotate the GC log file when it reaches 10 megabytes.
When using JDK 11 and the G1GC garbage collector to control your GC logs you will want to include property like this: java -Xlog:gc*:file=gc.log,filecount=10,filesize=10m. This will result in exactly the same behavior. we will have up to 10 GC log files with up to 10 megabytes in size.
Now that we know how important the JVM garbage collector logs are, and we’ve turned then on by default, we can start analyzing them.
How to Analyze GC Logs
Understanding garbage collection logs is not easy. It requires an understanding of how the Java virtual machine works and the understanding of memory usage of the application. In this blog post, we will skip the analysis of the application as it differs from application to application and requires knowledge of the code. What we will discuss though is how to read and analyze the garbage collection logs that we can get out of the JVM.
What is also very important is that there are various JVM versions and multiple garbage collector implementations. You can still encounter Java 7, 8, 9 and so on. Some companies still use Java 6 because of various reasons. Each version may be running different garbage collectors – Serial, Parallel, Concurrent Mark Sweep, G1 or even Shenandoah or Z. You can expect different Java versions and different garbage collector implementations to output a slightly different log format and of course we will not be discussing all of them. In fact, we will show you only a small portion of the logs, but such that should help you in understanding all other garbage collector logs as well.
The garbage collection logs will be able to answer questions like:
- When was the young generation garbage collector used?
- When was the old generation garbage collector used?
- How many garbage collections were run?
- For how long were the garbage collectors running?
- What was the memory utilization before and after garbage collection?
Let’s now look at an example taken out of a JVM garbage collector log and analyze each fragment highlighting the crucial parts behind it.
Parallel and Concurrent Mark Sweep Garbage Collectors
Let’s start by looking at Java 8 and the Parallel collector for the young generation space and the Concurrent Mark Sweep garbage collector for the old generation. A single line coming from our JVM garbage collector can look as follows:
2019-10-30T11:13:00.920-0100: 6.399: [Full GC (Allocation Failure) 2019-10-30T11:13:00.920-0100: 6.399: [CMS: 43711K->43711K(43712K), 0.1417937 secs] 63359K->48737K(63360K), [Metaspace: 47130K->47130K(1093632K)], 0.1418689 secs] [Times: user=0.14 sys=0.00, real=0.14 secs]First of all, you can see the date and time of the event which in our case is 2019-10-30T11:13:00.920-0100. This is the time when the event happened so that you can see what happened and when it happened.
The next thing we can see in the logline above is the type of garbage collection. In our case, it is Full GC and you can also expect GC as a value here. There are three types of garbage collector events that can happen:
- Minor garbage collection
- Major garbage collection
- Full garbage collection
Minor garbage collection means that the young generation space clearing event was performed by the JVM. The minor garbage collector will always be triggered when there is not enough memory to allocate a new object on the heap, i.e. when the Eden generation is full or is getting close to being full. If your application creates new objects very often you can expect the minor garbage collector to run often. What you should remember is that during minor garbage collection, when cleaning the Eden and survivor spaces the data is copied entirely which means that no memory fragmentation will happen.
Major garbage collection means that the tenured generation clearing event was performed. The tenured generation is also widely called the old generation space. Depending on the garbage collector and its settings the tenured generation cleaning may happen less or more often. Which is better? The right answer depends on the use-case and we will not be covering that in this blog post.
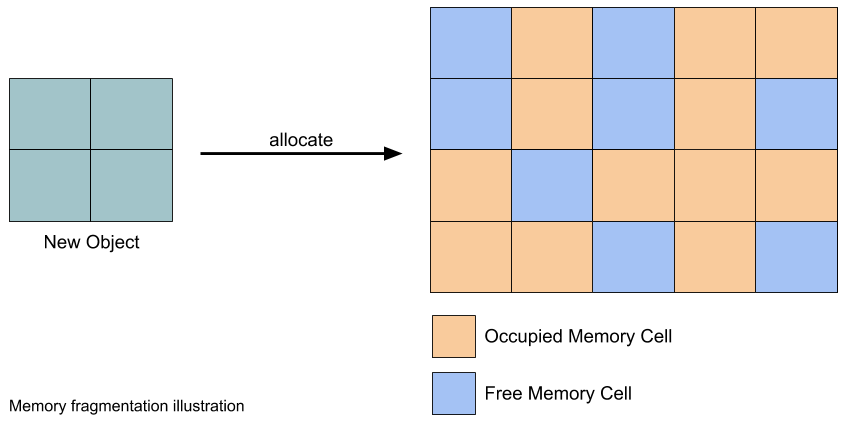
Java Full GC means that the full garbage collection event happened. Meaning that both the young and old generation was cleared. The garbage collector tried to clear it and the log tells us what the outcome of that procedure was. Tenured generation cleaning requires mark, sweep and compact phases to avoid high memory fragmentation. If a garbage collector wouldn’t care about memory fragmentation you could end up in a situation where you have enough memory, but it is fragmented and the object can’t be allocated. We can illustrate this situation with the following diagram:
There is also one part that we didn’t discuss – the Allocation Failure. The Allocation Failure part of the garbage collector logline explains why the garbage collection cycle started. It usually means that there was no space left for new object allocation in the Eden space of heap memory and the garbage collector tried to free some memory for new objects. The Allocation Failure can also be generated by the remark phase of the Concurrent Mark Sweep garbage collector.
The next important thing in the logline is the information about the memory occupation before and after the garbage collection process. Let’s look into the line once again in greater detail:
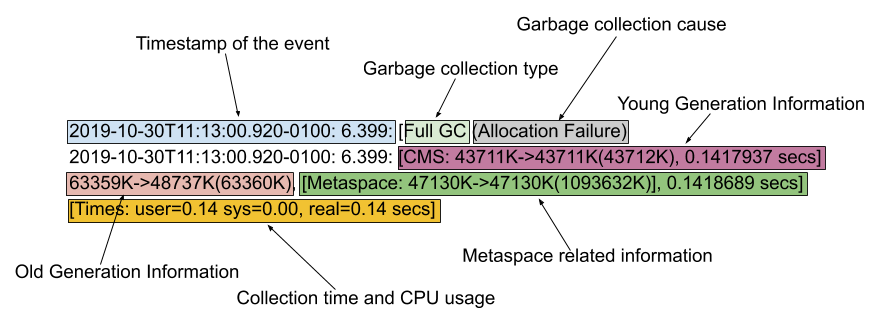
You can see that the line contains a lot of useful information. In addition to what we already discussed we also have information about the memory both before and after the collection. We have the time garbage collection took and CPU resources used during the garbage collection process. As you can see we have a lot of information allowing us to see how fast or slow the process is.
One piece of the very important information that the JVM garbage collector gives us is the total time for which the application threads are stopped. You can expect the threads to be stopped very often, but for a very short period of time. For example:
2019-10-29T10:00:28.879-0100: 0.488: Total time for which application threads were stopped: 0.0001006 seconds, Stopping threads took: 0.0000065 secondsYou can see that the threads were stopped for 0.0001006 seconds and the stopping of the threads took 0.0000065 seconds. This is not a long time for threads to be stopped and you will see information like this over and over again in your garbage collector logs. What should raise a red flag is a long thread stop time – also called a stop the world event that will basically stop your application. Here’s an example:
2019-11-02T17:11:54.259-0100: 7.438: Total time for which application threads were stopped: 11.2305001 seconds, Stopping threads took: 0.5230011 secondsIn the logline above, we can see that the application threads were stopped for more than 11 seconds. What does that mean? Basically, your application was not responding for more than 11 seconds. It wasn’t responding to any requests, it wasn’t processing data and the JVM was only doing garbage collection. You want to avoid situations like this at all costs. It is a sign of a big memory problem. Either your memory is too low for your application to properly do its job or you have a memory leak that fills up your heap space eventually leading to long garbage collection and finally to running out of memory. This means that your applications will not be able to create new objects and will stop working.
G1 Garbage Collector
Let’s now look at what the G1 garbage collector looks like. We will disable the previously used CMS garbage collector and turn on G1GC by using the following application options:
- -XX:+UseG1GC
- -XX:-UseConcMarkSweepGC
- -XX:-UseCMSInitiatingOccupancyOnly
So we turn on the G1 garbage collector and remove the Concurrent Mark Sweep.
A standard G1 garbage collector log entry looks as follows:
2019-11-03T21:26:21.827-0100: 2.069: [GC pause (G1 Evacuation Pause) (young)
Desired survivor size 2097152 bytes, new threshold 15 (max 15)
- age   1:     341608 bytes,     341608 total
, 0.0021740 secs]
   [Parallel Time: 0.9 ms, GC Workers: 10]
      [GC Worker Start (ms): Min: 2069.4, Avg: 2069.5, Max: 2069.6, Diff: 0.1]
      [Ext Root Scanning (ms): Min: 0.1, Avg: 0.2, Max: 0.4, Diff: 0.3, Sum: 1.5]
      [Update RS (ms): Min: 0.1, Avg: 0.2, Max: 0.3, Diff: 0.2, Sum: 2.3]
         [Processed Buffers: Min: 1, Avg: 1.4, Max: 4, Diff: 3, Sum: 14]
      [Scan RS (ms): Min: 0.0, Avg: 0.0, Max: 0.0, Diff: 0.0, Sum: 0.0]
      [Code Root Scanning (ms): Min: 0.0, Avg: 0.0, Max: 0.0, Diff: 0.0, Sum: 0.0]
      [Object Copy (ms): Min: 0.2, Avg: 0.3, Max: 0.3, Diff: 0.1, Sum: 3.0]
      [Termination (ms): Min: 0.0, Avg: 0.0, Max: 0.0, Diff: 0.0, Sum: 0.0]
         [Termination Attempts: Min: 1, Avg: 1.0, Max: 1, Diff: 0, Sum: 10]
      [GC Worker Other (ms): Min: 0.0, Avg: 0.0, Max: 0.0, Diff: 0.0, Sum: 0.1]
      [GC Worker Total (ms): Min: 0.6, Avg: 0.7, Max: 0.8, Diff: 0.1, Sum: 7.0]
      [GC Worker End (ms): Min: 2070.2, Avg: 2070.2, Max: 2070.2, Diff: 0.0]
   [Code Root Fixup: 0.0 ms]
   [Code Root Purge: 0.0 ms]
   [Clear CT: 0.2 ms]
   [Other: 1.1 ms]
      [Choose CSet: 0.0 ms]
      [Ref Proc: 0.8 ms]
      [Ref Enq: 0.0 ms]
      [Redirty Cards: 0.2 ms]
      [Humongous Register: 0.0 ms]
      [Humongous Reclaim: 0.0 ms]
      [Free CSet: 0.0 ms]
   [Eden: 26.0M(26.0M)->0.0B(30.0M) Survivors: 5120.0K->3072.0K Heap: 51.4M(64.0M)->22.6M(64.0M)]
 [Times: user=0.01 sys=0.00, real=0.01 secs]
In the logline above you can see that we had a young generation garbage collection event [GC pause (G1 Evacuation Pause) (young), which resulted in certain regions of memory being cleared: [Eden: 26.0M(26.0M)->0.0B(30.0M) Survivors: 5120.0K->3072.0K Heap: 51.4M(64.0M)->22.6M(64.0M)]. We also have the timing information and CPU usage [Times: user=0.01 sys=0.00, real=0.01 secs]. The timings are exactly the same as in the previous garbage collector discussion. The user and system scope CPU usage during the garbage collection process and we have the time it took.
The memory information summary is detailed and gives us an overview of what happened. We can see that the Eden space was fully cleared Eden: 26.0M(26.0M)->0.0B(30.0M). The garbage collection started when it was occupied by 26M of data. After the garbage collection, we ended with a completely empty Eden space. The total size of the Eden space at the point of garbage collection was 30MB. The garbage collection started with the survivors’ space having 5120K of memory and ended with 3072K of data in it. Finally, the whole heap started with 51.4M occupied out of the total size of 64M and ended with 22.6M of occupation.
In addition to that, you also see more detailed information about the internals of the parallel garbage collector workers and the phases of their work – like the start, scanning and working.
You can also see additional log entries related to G1 garbage collector:
2019-11-03T21:26:23.704-0100: 2019-11-03T21:26:23.704-0100: 3.946: 3.946: [GC concurrent-root-region-scan-start]
Total time for which application threads were stopped: 0.0035771 seconds, Stopping threads took: 0.0000111 seconds
2019-11-03T21:26:23.706-0100: 3.948: [GC concurrent-root-region-scan-end, 0.0017994 secs]
2019-11-03T21:26:23.706-0100: 3.948: [GC concurrent-mark-start]
2019-11-03T21:26:23.737-0100: 3.979: [GC concurrent-mark-end, 0.0315921 secs]
2019-11-03T21:26:23.737-0100: 3.979: [GC remark 2019-11-03T21:26:23.737-0100: 3.979: [Finalize Marking, 0.0002017 secs] 2019-11-03T21:26:23.738-0100: 3.980: [GC ref-proc, 0.0004151 secs] 2019-11-03T21:26:23.738-0100: 3.980: [Unloading, 0.0025065 secs], 0.0033738 secs]
 [Times: user=0.04 sys=0.01, real=0.01 secs]
2019-11-03T21:26:23.741-0100: 3.983: Total time for which application threads were stopped: 0.0034705 seconds, Stopping threads took: 0.0000308 seconds
2019-11-03T21:26:23.741-0100: 3.983: [GC cleanup 54M->54M(64M), 0.0004419 secs]
 [Times: user=0.00 sys=0.00, real=0.00 secs]
Of course, the above log lines are different, but the principles still stand. The log gives us information about the total time for which the application threads were stopped, the result of the cleanup done by the garbage collector and the resources used.
GC Logging Options in Java 9 and Newer
We can even go deeper with garbage collection and turn on the debug level. Let’s take Java 10 as an example and let’s include the -Xlog:gc*,gc+phases=debug to the startup parameters of the JVM. This will turn on debug level logging for the garbage collection phases for the default G1 garbage collector on Java 10. This will enable verbose GC logging giving you extensive information about garbage collector work.
[0.006s][info][gc,heap] Heap region size: 1M
[0.012s][info][gc     ] Using G1
[0.013s][info][gc,heap,coops] Heap address: 0x00000006c0000000, size: 4096 MB, Compressed Oops mode: Zero based, Oop shift amount: 3
[0.428s][info][gc,start     ] GC(0) Pause Young (G1 Evacuation Pause)
[0.428s][info][gc,task      ] GC(0) Using 2 workers of 2 for evacuation
[0.432s][info][gc,phases    ] GC(0)   Pre Evacuate Collection Set: 0.0ms
[0.433s][debug][gc,phases    ] GC(0)     Prepare TLABs: 0.0ms
[0.433s][debug][gc,phases    ] GC(0)     Choose Collection Set: 0.0ms
[0.433s][debug][gc,phases    ] GC(0)     Humongous Register: 0.0ms
[0.433s][info ][gc,phases    ] GC(0)   Evacuate Collection Set: 3.8ms
[0.433s][debug][gc,phases    ] GC(0)     Ext Root Scanning (ms):   Min:  0.6, Avg:  0.7, Max:  0.8, Diff:  0.2, Sum:  1.4, Workers: 2
[0.433s][debug][gc,phases    ] GC(0)     Update RS (ms):           Min:  0.0, Avg:  0.0, Max:  0.0, Diff:  0.0, Sum:  0.0, Workers: 2
[0.433s][debug][gc,phases    ] GC(0)       Processed Buffers:        Min: 0, Avg:  0.0, Max: 0, Diff: 0, Sum: 0, Workers: 2
[0.433s][debug][gc,phases    ] GC(0)       Scanned Cards:            Min: 0, Avg:  0.0, Max: 0, Diff: 0, Sum: 0, Workers: 2
[0.433s][debug][gc,phases    ] GC(0)       Skipped Cards:            Min: 0, Avg:  0.0, Max: 0, Diff: 0, Sum: 0, Workers: 2
[0.433s][debug][gc,phases    ] GC(0)     Scan RS (ms):             Min:  0.0, Avg:  0.0, Max:  0.0, Diff:  0.0, Sum:  0.0, Workers: 2
[0.433s][debug][gc,phases    ] GC(0)       Scanned Cards:            Min: 0, Avg:  0.0, Max: 0, Diff: 0, Sum: 0, Workers: 2
[0.433s][debug][gc,phases    ] GC(0)       Claimed Cards:            Min: 0, Avg:  0.0, Max: 0, Diff: 0, Sum: 0, Workers: 2
[0.433s][debug][gc,phases    ] GC(0)       Skipped Cards:            Min: 0, Avg:  0.0, Max: 0, Diff: 0, Sum: 0, Workers: 2
[0.433s][debug][gc,phases    ] GC(0)     Code Root Scanning (ms):  Min:  0.0, Avg:  0.1, Max:  0.1, Diff:  0.1, Sum:  0.1, Workers: 2
[0.433s][debug][gc,phases    ] GC(0)     AOT Root Scanning (ms):   skipped
[0.433s][debug][gc,phases    ] GC(0)     Object Copy (ms):         Min:  2.8, Avg:  2.9, Max:  3.0, Diff:  0.2, Sum:  5.7, Workers: 2
[0.433s][debug][gc,phases    ] GC(0)     Termination (ms):         Min:  0.0, Avg:  0.0, Max:  0.0, Diff:  0.0, Sum:  0.0, Workers: 2
[0.433s][debug][gc,phases    ] GC(0)       Termination Attempts:     Min: 1, Avg:  1.0, Max: 1, Diff: 0, Sum: 2, Workers: 2
[0.433s][debug][gc,phases    ] GC(0)     GC Worker Other (ms):     Min:  0.0, Avg:  0.0, Max:  0.0, Diff:  0.0, Sum:  0.0, Workers: 2
[0.433s][debug][gc,phases    ] GC(0)     GC Worker Total (ms):     Min:  3.6, Avg:  3.6, Max:  3.7, Diff:  0.1, Sum:  7.3, Workers: 2
[0.433s][info ][gc,phases    ] GC(0)   Post Evacuate Collection Set: 0.1ms
[0.433s][debug][gc,phases    ] GC(0)     Code Roots Fixup: 0.0ms
[0.433s][debug][gc,phases    ] GC(0)     Preserve CM Refs: 0.0ms
[0.433s][debug][gc,phases    ] GC(0)     Reference Processing: 0.0ms
[0.433s][debug][gc,phases    ] GC(0)     Clear Card Table: 0.0ms
[0.433s][debug][gc,phases    ] GC(0)     Reference Enqueuing: 0.0ms
[0.433s][debug][gc,phases    ] GC(0)     Merge Per-Thread State: 0.0ms
[0.433s][debug][gc,phases    ] GC(0)     Code Roots Purge: 0.0ms
[0.433s][debug][gc,phases    ] GC(0)     Redirty Cards: 0.0ms
[0.433s][debug][gc,phases    ] GC(0)     DerivedPointerTable Update: 0.0ms
[0.433s][debug][gc,phases    ] GC(0)     Free Collection Set: 0.0ms
[0.433s][debug][gc,phases    ] GC(0)     Humongous Reclaim: 0.0ms
[0.433s][debug][gc,phases    ] GC(0)     Start New Collection Set: 0.0ms
[0.433s][debug][gc,phases    ] GC(0)     Resize TLABs: 0.0ms
[0.433s][debug][gc,phases    ] GC(0)     Expand Heap After Collection: 0.0ms
[0.433s][info ][gc,phases    ] GC(0)   Other: 0.2ms
[0.433s][info ][gc,heap      ] GC(0) Eden regions: 7->0(72)
[0.433s][info ][gc,heap      ] GC(0) Survivor regions: 0->1(1)
[0.433s][info ][gc,heap      ] GC(0) Old regions: 0->1
[0.433s][info ][gc,heap      ] GC(0) Humongous regions: 6->3
[0.433s][info ][gc,metaspace ] GC(0) Metaspace: 9281K->9281K(1058816K)
[0.433s][info ][gc           ] GC(0) Pause Young (G1 Evacuation Pause) 13M->4M(122M) 4.752ms
[0.433s][info ][gc,cpu       ] GC(0) User=0.00s Sys=0.01s Real=0.00s
You can see the exact timings in the highlighter section of the logline above. They were not present in the G1 garbage collector log that we were discussing earlier. Of course, phases are not the only option that you can turn on. Those are options that became available with Java 9 and are here to correspond to the flags that were removed or deprecated. Here are some of the options available in the earlier Java Virtual Machine versions and the options that they translate to in Java 9 and newer:
- -XX:+PrintHeapAtGC can now be expressed as -Xlog:gc+heap=debug option
- -XX:+PrintParallelOldGCPhasesTimes can be expressed as -Xlog:gc+phases*=trace
- -XX:+PrintGCApplicationConcurrentTime and -XX:+PrintGCApplicationStoppedTime can now be expressed as -Xlog:safepoint
- -XX:+G1PrintHeapRegions can be expressed as -Xlog:gc+region*=trace
- -XX:+SummarizeConcMark can be expressed as -Xlog:gc+marking*=trace
- -XX:+SummarizeRSetStats can be expressed as -Xlog:gc+remset*=trace
- -XX:+PrintJNIGCStalls can be expressed as -Xlog:gc+jni*=debug
- -XX:+PrintTaskqueue can be expressed as -Xlog:gc+task+stats*=trace
- -XX:+TraceDynamicGCThreads can be expressed as -Xlog:gc+task*=trace
- -XX:+PrintAdaptiveSizePolicy can be expressed as -Xlog:gc+ergo*=trace
- -XX:+PrintTenuringDistribution can be expressed as -Xlog:gc+age*=trace
You can combine multiple options or enable all of them by adding the -Xlog:all=trace flag to your JVM application startup parameters. But be aware that it can result in quite a lot of information in the garbage collector log files. To avoid the flood of information you can set it to debug using -Xlog:all=debug – it will lower down the amount of information, but it will give you way more than the standard garbage collector log.
Java Garbage Collection Logging: Log Analysis Tools you Need to Know About
There are tools that can help you analyze the garbage collector logs. Nothing available out of the box in the standard Java Virtual Machine distribution though.
APM & Observability Tools
When it comes to observing the high-level overview of the performance of the Java garbage collector, you can use one of the observability tools providing Java application-level monitoring. For example, our own Sematext JVM Monitoring provided by Sematext Cloud.
A tool like this should give you summary information about how the garbage collector works, the times, collection count the maximum collection time and the average collection size. In most cases, this is more than enough to spot issues with the garbage collection without the need of going deep into the logs and analyzing them.
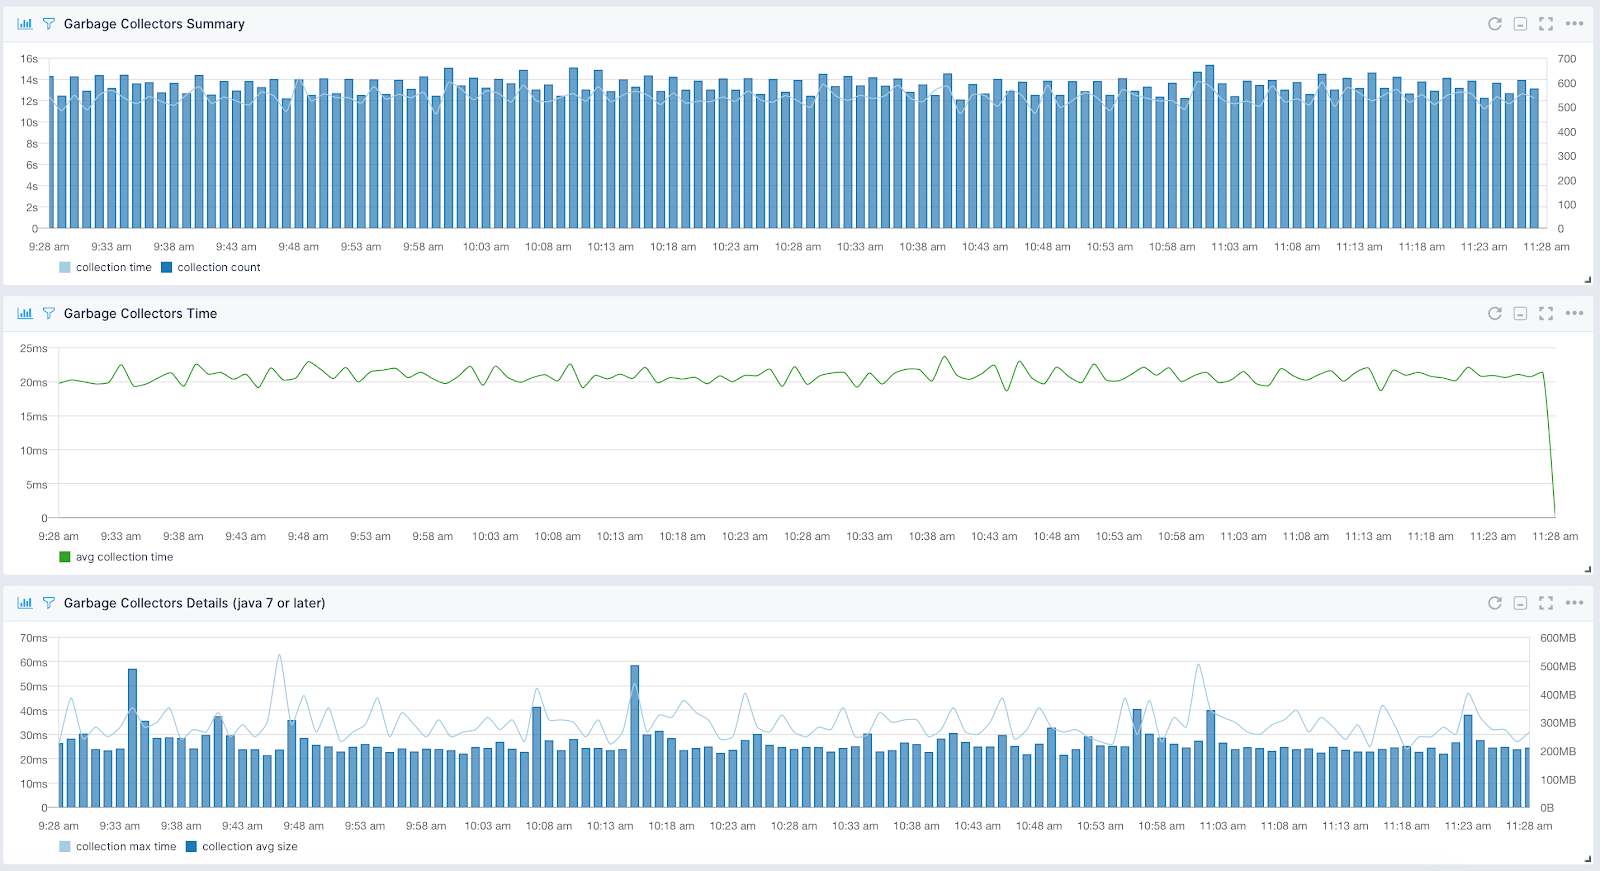
However, when troubleshooting you may need to have a more fine-grained view over what was happening inside the garbage collector in the JVM. If you don’t want to analyze the data manually there are tools that can help you.
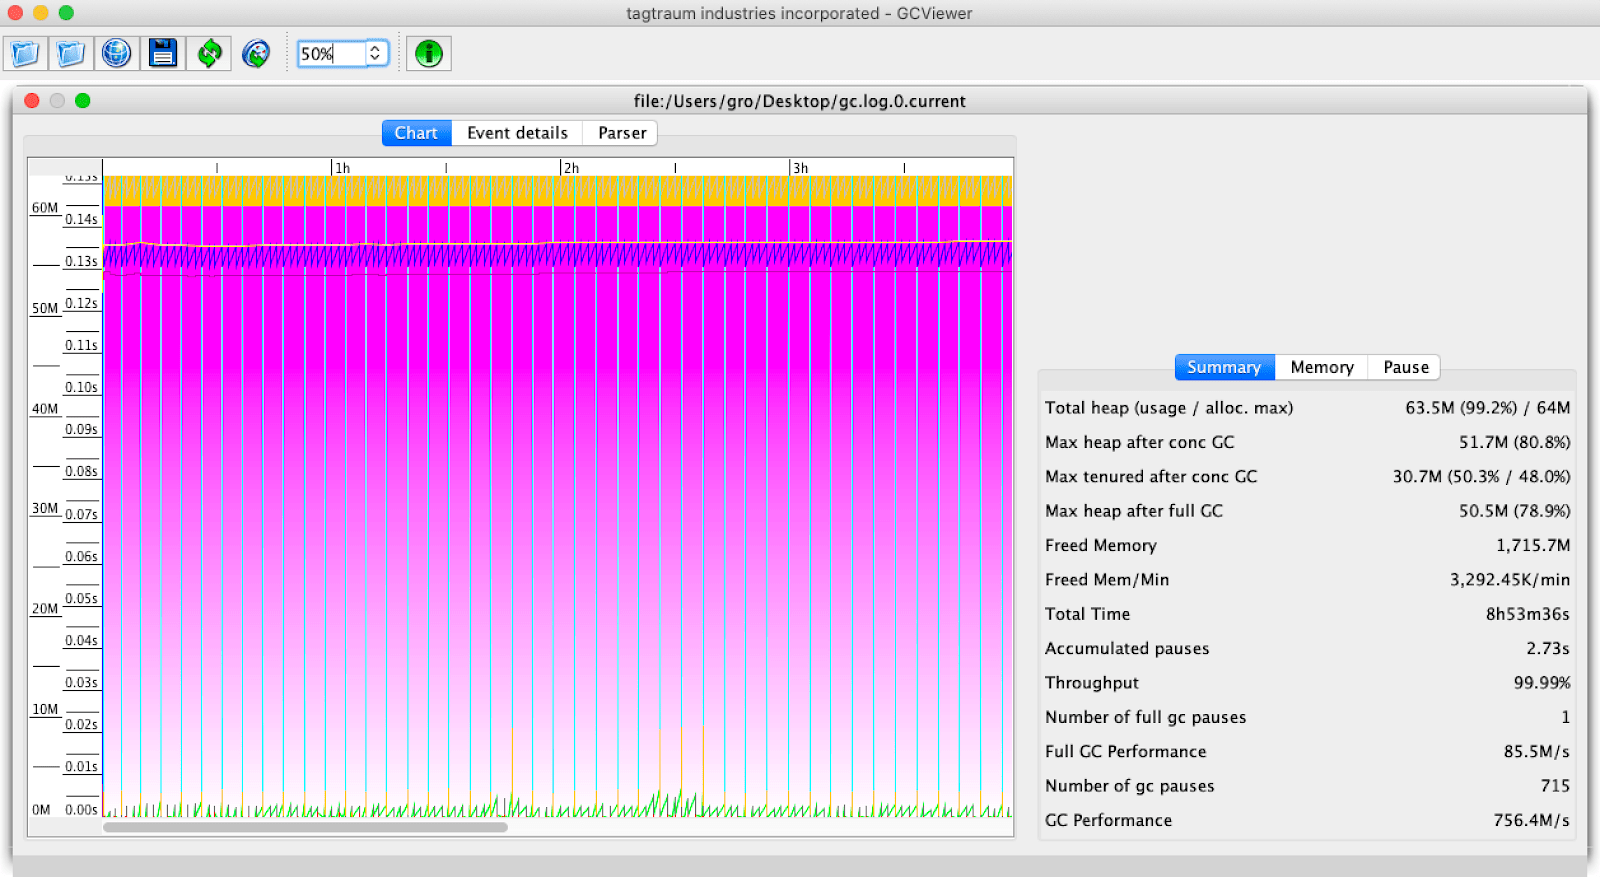
GCViewer
For example one of the tools that can help you visualize the GC logs is the GCViewer. A tool that allows you to analyze the garbage collector logs up to Java 1.5 and its continuation aiming to support newer Java versions and the G1 garbage collector.
The GC Viewer aims to provide comprehensive information about memory utilization and the garbage collector process overall. It is open-sourced and completely free for personal and commercial use aiming to provide support up to and including Java 8 and with unified logging for OpenJDK 9 and 10.
GCEasy
There are also tools that are proprietary and commercial. One of them is GCEasy. This is an online GC log analyzer tool where you can upload the garbage collection log and get the results in the form of an easy to read log analysis report:
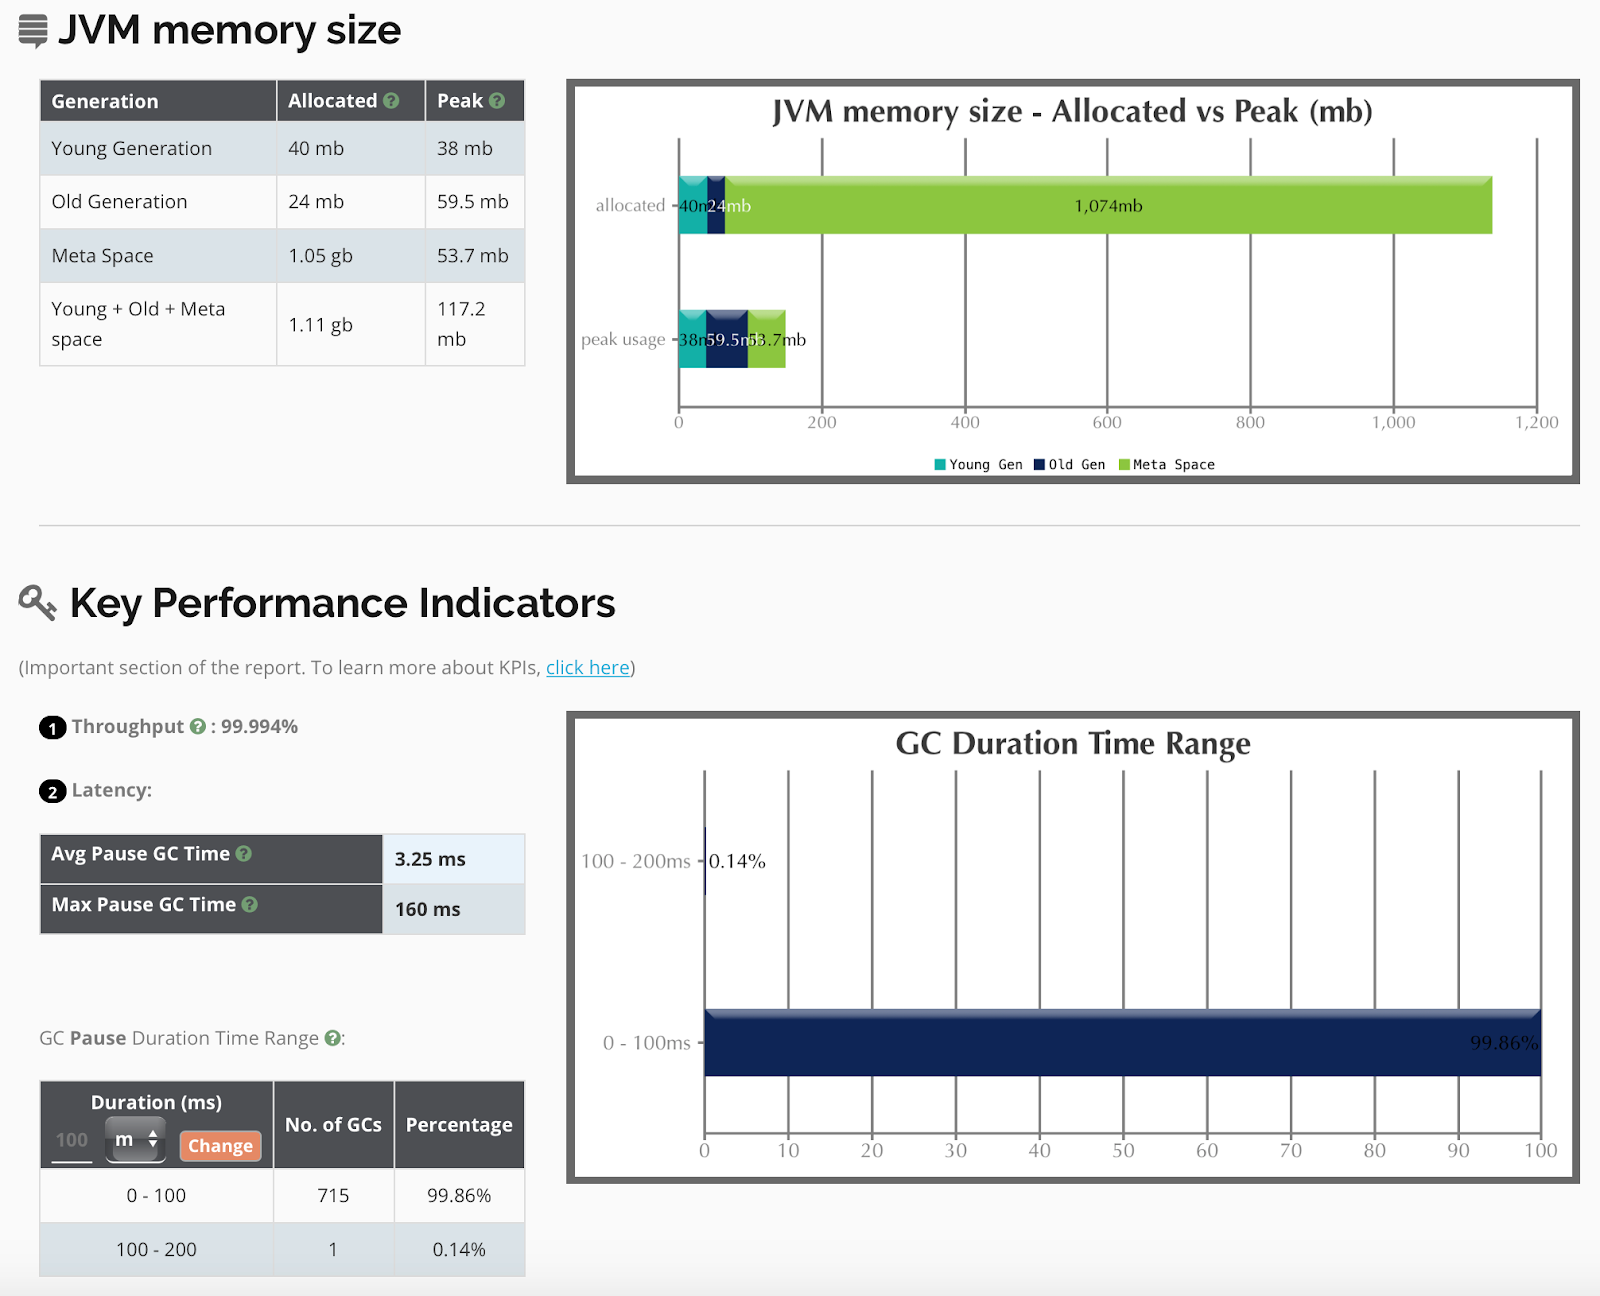
The report will include information like generation size and maximum size, key performance indicators like average and maximum pause time, pauses statistics, memory leak information and interactive graphs showing you each heap memory space. All of that information calculated on the basis of the log file that you provide.
Even though the GCEasy has a free plan it is limited. At the time of writing a single user could upload 5 GC log files a month with up to 50mb per file. There are additional plans available if you are interested in using the tool.
Wrapping Up
Understanding garbage collector logs is not easy. A large number of possible formats, different Java Virtual Machine versions, and different garbage collector implementations don’t make it simpler. Even though there are a lot of options you have to remember, certain parts are common. Each garbage collector will tell you the size of the heap, the before and after occupancy of the region of the heap that was cleared. Finally, you will also see the time and resources used to perform the operation. Start from that and continue the journey of understanding the JVM garbage collection process and the memory usage of your application. Happy analysis ?
This article has been published from a wire agency feed without modifications to the text. Only the headline has been changed.


