Tens of thousands of customers use Amazon Redshift to power their workloads to enable modern analytics use cases, such as Business Intelligence, predictive analytics, and real-time streaming analytics. As an administrator or data engineer, it’s important that your users, such as data analysts and BI professionals, get optimal performance. You can use the Amazon Redshift console to monitor and diagnose query performance issues.
The Amazon Redshift console features a monitoring dashboard and updated flows to create, manage, and monitor Amazon Redshift clusters. For more information, see Simplify management of Amazon Redshift clusters with the Redshift console.
This post discusses how you can use the new Amazon Redshift console to monitor your user queries, identify slow queries, and terminate runaway queries. The post also reviews details such as query plans, execution details for your queries, in-place recommendations to optimize slow queries, and how to use the Advisor recommendations to improve your query performance.
User query vs. rewritten query
Any query that users submit to Amazon Redshift is a user query. Analysts either author a user query or a BI tool such as Amazon QuickSight or Tableau generates the query. Amazon Redshift typically rewrites queries for optimization purposes. It can rewrite a user query into a single query or break it down into multiple queries. These queries are rewritten queries.
The following steps are performed by Amazon Redshift for each query:
- The leader node receives and parses the query.
- The parser produces an initial query tree, which is a logical representation of the original query. Amazon Redshift inputs this query tree into the query optimizer.
- The optimizer evaluates and, if necessary, rewrites the query to maximize its efficiency. This process sometimes results in creating multiple queries to replace a single query.
The query rewrite is done automatically and is transparent to the user.
Query monitoring with the original Amazon Redshift console and system tables
Previously, you could monitor the performance of rewritten queries in the original Amazon Redshift console or system tables. However, it was often challenging to find the SQL your users submitted.
The following table shows the comparison of query monitoring differences between the original Amazon Redshift console, system tables, and the new console.
| Original Console | System Tables | New Console |
| • User query not supported
• Monitor only rewritten queries • Shows only top 100 queries |
• User query not available
• Rewritten queries • All rewritten queries |
• Supports user queries
• Shows all queries available in system tables • Allows you to correlate rewritten queries with user queries |
The new console simplifies monitoring user queries and provides visibility to all query monitoring information available in the system.
Monitoring and diagnosing queries
The Amazon Redshift console provides information about the performance of queries that run in the cluster. You can use this information to identify and diagnose queries that take a long time to process and create bottlenecks that prevent other queries from executing efficiently.
The following table shows some of the common questions you may have when monitoring, isolating, and diagnosing query performance issues.
| Monitor | Isolate and Diagnose | Optimize |
| How is my cluster doing in terms of query performance and resource utilization? | A user complained about performance issues at a specific time. How do I identify that SQL and diagnose problems? | How can I optimize the SQL that our end-users author? |
| How is my cluster throughput, concurrency, and latency looking? | Which other queries were running when my query was slow? Were all queries slow? | Is there any optimization required in my schema design? |
| Are queries being queued in my cluster? | Is my database overloaded with queries from other users? Is my queue depth increasing or decreasing? | Is there any tuning required for my WLM queues? |
| Which queries or loads are running now? | How do I identify queries that a specific user runs? | Can I get any benefit if I enable concurrency scaling? |
| Which queries or loads are taking longer than usual timing? | The resources of my cluster are running very high. How do I find out which queries are running? | |
| What are my top queries by duration in the last hour or last 24 hours? | ||
| Which queries have failed? | ||
| Is the average query latency for my cluster increasing or decreasing over time? |
You can answer these questions by either using the Amazon Redshift console or developing scripts using the system catalog.
Monitoring queries
You can monitor your queries on the Amazon Redshift console on the Queries and loads page or on the Query monitoring tab on the Clusters page. While both options are similar for query monitoring, you can quickly get to your queries for all your clusters on the Queries and loads page. You have to select your cluster and period for viewing your queries.
You can view the queries using List view on the Query monitoring tab on the Clusters page. The query monitoring page visually shows the queries in a Gantt chart.
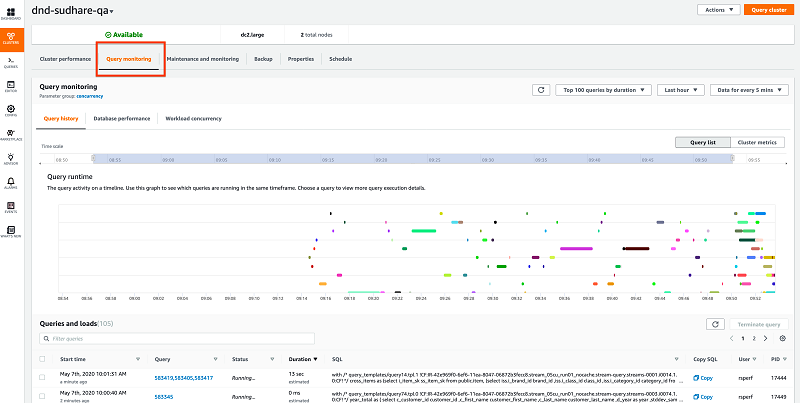
Each bar represents a user query, and the length of the bar represents runtime for a query. The X-axis shows the selected period, and the location of the bar indicates when a query started and ended. The queries include both standard SQL statements such as SELECT, INSERT, and DELETE, and loads such as COPY commands.
Monitoring top queries
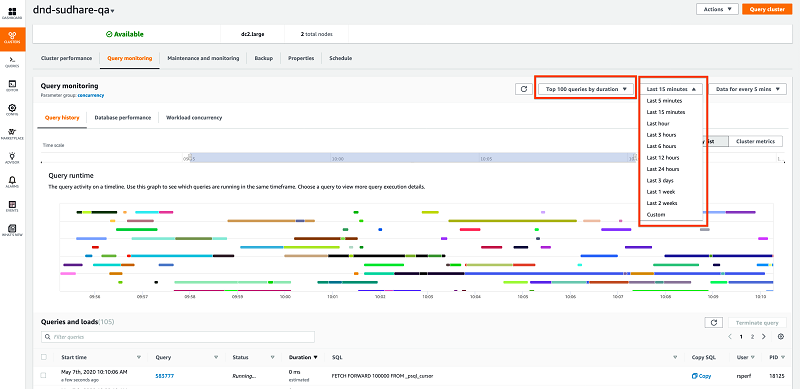
By default, the Query monitoring page shows the top 100 longest queries by runtime or duration for the selected time window. You can change the time window to view the top queries for that period. The top queries also include completed queries and running queries. The completed queries are sorted by descending order of query runtime or duration.
Identifying running queries
You can find out your running queries by choosing Running queries from the drop-down menu.

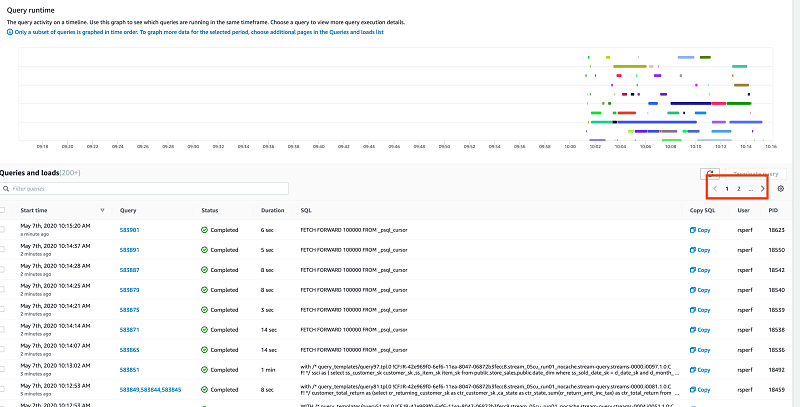
To see the query’s details such as SQL text, runtime details, related rewritten queries, and execution details, choose the query ID.
The Duration column shows the estimated duration and runtime for a query. You can terminate a query by selecting the query and choosing Terminate query. You need the have the redshift:CancelQuerySession action added to your IAM policy to cancel a query.
Viewing loads
As a data engineer or Redshift administrator, ensuring that your load jobs complete correctly and meet required performance SLAs is a major priority.
You can view all your load jobs by choosing Loads from the drop-down menu on the Query monitoring page. You can then zoom in on the desired time window.
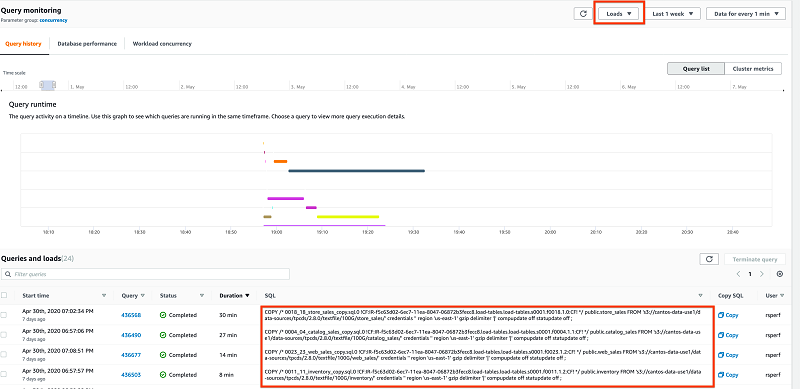
The preceding Gantt chart shows all loads completed successfully. The query status indicates if the load failed or if an administrator terminated it.
Identifying failed queries
You can identify failed queries by choosing Failed or stopped queries from the drop-down menu on the Query monitoring page and then zooming in on the desired time.

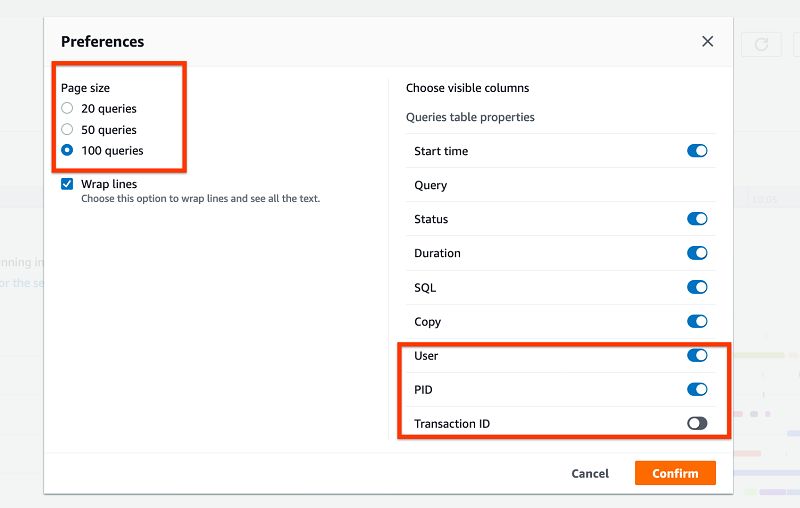
The query page shows 50 queries by default, and you have to paginate to view more results. You can change the page size by choosing the settings gear icon.

In the Preferences section, you can customize what fields you want to see on the Queries and loads list. For example, you can see the PID and not the transaction ID. These changes persist across browser sessions.
Monitoring long-running queries
Amazon Redshift categorizes queries if a query or load runs more than 10 minutes. You can filter long-running queries by choosing Long queries from the drop-down menu. Similarly, you can also filter medium and short queries.

Isolating problematic queries
The following section looks at some use cases in which you use the console to diagnose query performance issues.
Query performance issues
For this use case, a user complains that their queries as part of the dashboards are slow, and you want to identify the associated queries. These queries might not be part of the top queries. To isolate these queries, you can either choose Completed queries or All queries from the drop-down menu and specify the time window by choosing Custom.

You can also drill down to view the queries in a specific period, or filter for queries from one particular user by searching their user name.

You can also filter your queries by searching SQL query text.

As with the earlier charts, the size of a bar represents a relative duration of the runtime for a query. In this period, the highlighted query is the slowest. If you mouse over a bar in the Gantt chart, it provides helpful information about the query such as query ID, part of the query text, and runtime. To view details about a specific query, choose Query ID.

Identifying systemic query performance problems
For this use case, many of your users are complaining about longer-than-normal query runtimes. You want to diagnose what is happening in your cluster. You can customize your time and switch to the graph view, which helps you to correlate longer runtimes with what is happening in the cluster. As the following Gantt chart and CPU utilization graph shows, many queries were running at that time, and CPU utilization almost reached 100%.

The concurrency scaling feature of Amazon Redshift could have helped maintain consistent performance throughput the workload spike.
High CPU utilization
You can correlate query performance with cluster performance and highlight on a given metric such as CPU utilization, which shows you which queries were running at that time.

Monitoring workload performance
You can get a detailed view of your workload’s performance by looking at the Workload execution breakdown chart. You can find out how long it took to plan, wait, and execute your workload. You can also view time spent in operations such as INSERT, UPDATE, DELETE, COPY, UNLOAD, or CTAS. The chosen time in the query history is stored when you navigate between pages.

In the preceding screenshot, you can see several waits in the workload breakdown graph. You can take advantage of concurrency scaling to process a burst of queries.
Correlating query throughput with query duration
You can view the trend of the performance of your queries, such as duration or execution time for your long, medium, and short queries, and correlate with the query throughput.

This information can offer insight into how well the cluster serves each query category with its current configuration.
Monitoring workload for your WLM queues
You can correlate query performance with cluster performance and highlight a given metric such as CPU utilization to see which queries were running at that time. You can view the average throughput, average duration, and average queue time by different WLM queues. Insight from this graph might help you tune your queries; for example, by assigning the right priority for your WLM queue or enabling concurrency scaling for your WLM queue.

Diagnosing and optimizing query performance
After you isolate a slow query, you can drill down to the execution details of the query by choosing Query ID. The following screenshot shows multiple query IDs for a query that has been rewritten to multiple queries.

The Query details page shows you the parent query and all rewritten queries.

You can also find out whether any of the rewritten queries ran on a concurrency scaling cluster.
You can view the query plans, execution statistics such as the cost of each step of the plan, and data scanned for the query.

You can also view the cluster metrics at the time the query ran on the cluster. The following screenshot shows the problematic steps for your query plan. Choosing a problematic step reveals in-place recommendations to improve this query.

Implementing Advisor recommendations
Amazon Redshift Advisor provides recommendations that could improve workload performance. Amazon Redshift uses machine learning to look at your workload and provide customized recommendations. Amazon Redshift monitors and offers guidance for improved performance on the following crucial areas:
- Short query acceleration (SQA) – Checks for query patterns and reports the number of recent queries in which you can reduce latency and the daily queue time for SQA-eligible queries by enabling SQA, thus improving your query performance
- Sort key for tables – Analyzes the workload for your data warehouse over several days to identify a beneficial sort key for your tables and makes sort key recommendations
- Distribution key for tables – Analyzes your workload to identify the most appropriate distribution key for tables that can significantly benefit from a key distribution style
The following screenshot shows a recommendation to alter the distribution key for the table.

Enabling concurrency scaling
To deliver optimal performance for your users, you can monitor user workloads and take action if you diagnose a problem. You can drill down to the query history for that specific time, and see several queries running at that time.

If you aren’t using concurrency scaling, your queries might be getting queued. You can also see that on the Workload concurrency tab. In the following screenshot, you can see that many queries are queued during that time because you didn’t enable concurrency scaling.

You can monitor all submitted queries and enable concurrency scaling when queued queries are increasing.
View a demo of Query Monitoring to learn more about the feature:
Conclusion
This post showed you the new features in the Amazon Redshift console that allow you to monitor user queries and help you diagnose performance issues in your user workload. The console also allows you to view your top queries by duration, filter failed, and long-running queries, and help you drill down to view related rewritten queries and their execution details, which you can use to tune your queries. Start using the query monitoring features of the new Amazon Redshift console to monitor your user workload today!
This article has been published from the source link without modifications to the text. Only the headline has been changed.


