Veteran crypto investors have seen this picture before. Bitcoin nearly doubled since the beginning of December to January 8, 2021, then the bubble started to blow off some steam with a 20% price drop in the last three days.
It’s much the same story for Ethereum, Litecoin, Bitcoin Cash and other cryptocurrencies, all of them virtually doubling over a period of five weeks. Ethereum is down 24% in the last two days after coming within a whisker of its previous all-time high of $1 450.
The spectacle of Trump supporters invading Capitol Hill last week and the aftermath of a contested election only fuelled an already white-hot crypto furnace.
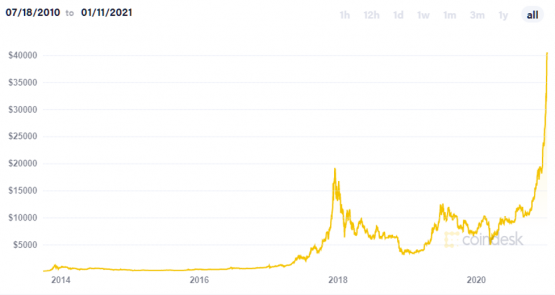
The last time we saw something like this was in December 2017, when the bitcoin price almost doubled to $20 000. Last week, bitcoin hit $41 000, more than doubling its price in little over a month, before dropping 20%.
After the 2017 peak, the price crashed by 84% over the next year before beginning a slow recovery. This time analysts are suggesting the price drop is unlikely to be as severe, in large measure because of substantial institutional buying power now being firehosed into cryptos.
But the parabolic rise in the bitcoin price over the last month puts it into seriously overbought territory, and a correction is overdue.
Bitcoin price in USD
The flow of institutional money into bitcoin could get a whole lot bigger should the US Securities Exchange Commission approve a bitcoin exchange-traded fund (ETF) this year. While this should be positive for bitcoin in the longer term, in the near term it could have a negative impact on price, according to a recent report from JP Morgan.
Many institutions hunting for exposure to bitcoin are required to do so by buying shares in Grayscale Bitcoin Trust, for which they pay a premium to net asset value. JP Morgan argues the arrival of a bitcoin ETF would reduce this premium and result in some of these institutions selling out of Grayscale once the six month lock-up period expires.
While that might hurt the bitcoin price in the short term, there seems little prospect of a drop similar to that of 2018.
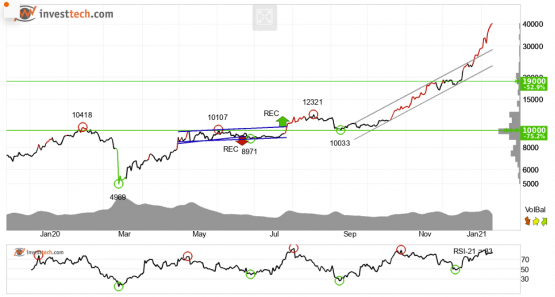
According to this analysis by Investtech.com, bitcoin’s price has broken out of its rising channel, which is a positive indicator. “This signals an even stronger growth rate. There is no resistance in the price chart and further rise is indicated. In case of a negative reaction, the stock has support at approximately $19 000.”

A recent report by Kraken Intelligence identifies number of reasons for the recent surge in cryptos:
- Big Buying: Institutional adoption continued as companies such as MassMutual, SkyBridge Capital and One River Asset Management made multimillion-dollar Bitcoin allocations, while the CME announced it would offer ETH futures and Dow Jones said it will provide cryptocurrency indices in 2021.
- More room for upside: The most recent parabolic run has left plenty of room for speculation among believers and sceptics. The technicals provide a much simpler picture – there is room for upside. Kraken projects prices could continue even higher, as history shows major crypto market tops often reach specific multiples of major indicators.
- Correlation to riskier markets: A tighter correlation between bitcoin and riskier traditional assets has emerged.
“Notwithstanding bitcoin and the broader market’s momentum since October 2020, it ought to be noted that January is, on average, the second most volatile and third worst-performing month on record. Not to mention, when looking at historical first quarter returns, one can see that the first quarter is typically a negative yielding period for bitcoin,” says Kraken Intelligence.
Bitcoin ‘whales’ – those with more than 100 bitcoin – accumulated an additional 47 500 bitcoin during the cryptocurrency’s ruthless December rally.
This was accompanied by bitcoin buyers taking purchases offline, storing crypto assets in ‘cold’ wallets (disconnected from the internet, to safeguard against hacking). This is a signal that they have little intention of selling.
In prior bull markets, bitcoin has traded up anywhere from 10 to 15 times its 200-week moving average, which is currently around $8 000. If history is any guide, this would imply a price of between $79 040 and $118 560, says Kraken Intelligence.
This article has been published from a wire agency feed without modifications to the text. Only the headline has been changed.


