The 2021 AI Index provides insight into jobs, publications, diversity, and more
If you haven’t had time to read the AI Index Report for 2021, which clocks in at 222 pages, don’t worry—we’ve got you covered. The massive document, produced by the Stanford Institute for Human-Centered Artificial Intelligence, is packed full of data and graphs, and we’ve plucked out 15 that provide a snapshot of the current state of AI.
Deeply interested readers can dive into the report to learn more; it contains chapters on R&D, technical performance, the economy, AI education, ethical challenges of AI applications, diversity in AI, and AI policy and national strategies.
1. We’re Living in an AI Summer
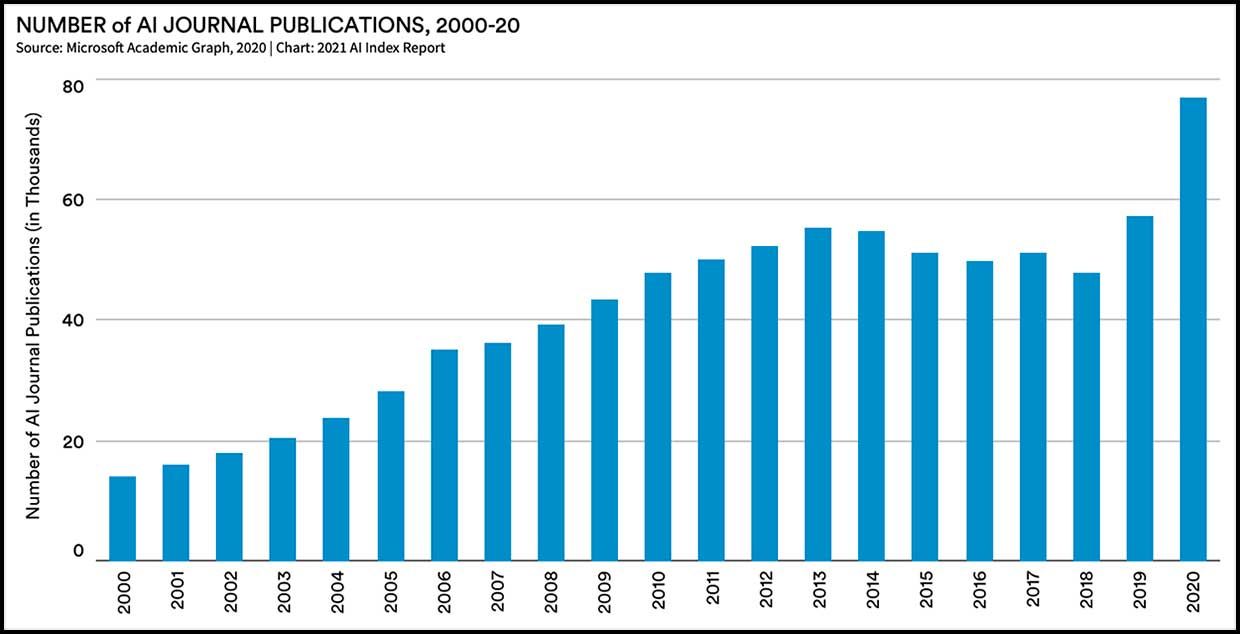
AI research is booming: More than 120,000 peer-reviewed AI papers were published in 2019. The report also notes that between 2000 and 2019, AI papers went from being 0.8 percent of all peer-reviewed papers to 3.8 percent in 2019.
2. China Takes Top Citation Honors
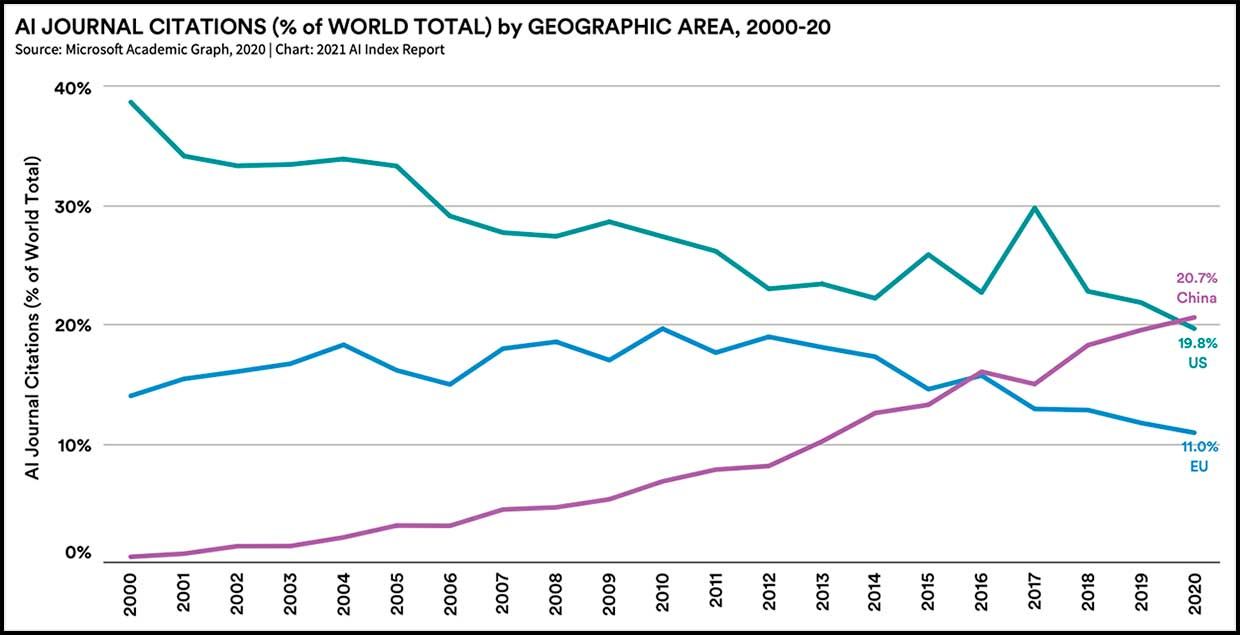
It’s old news that Chinese researchers are publishing the most peer-reviewed papers on AI–China took that lead in 2017. The news this year is that, as of 2020, papers by Chinese researchers that were published in AI journals are receiving the largest share of citations.
Jack Clark, co-director of the AI Index Steering Committee, tells IEEE Spectrum that the data seems like “an indicator of academic success” for China, and is also a reflection of different AI ecosystems in different countries. “China has a stated policy of getting journal publications,” he notes, and government agencies play a larger role in research, whereas in the United States, a good portion of R&D happens within corporations. “If you’re an industry, you have less incentive to do journal articles,” he says. “It’s more of a prestige thing.”
3. Faster Training = Better AI

This data comes from MLPerf, an effort to objectively rank the performance of machine learning systems. Image classifier systems from a variety of companies were trained on the standard ImageNet database, and ranked on the amount of time it took to train them. In 2018, it took 6.2 minutes to train the best system; in 2020 it took 47 seconds. This extraordinary improvement was enabled by the adoption of accelerator chips that are specifically designed for machine learning.
The report states the impact of this speed-up: “Imagine the difference between waiting a few seconds for a system to train versus waiting a few hours, and what that difference means for the type and volume of ideas researchers explore and how risky they might be.”
4. AI Doesn’t Understand Coffee Drinking
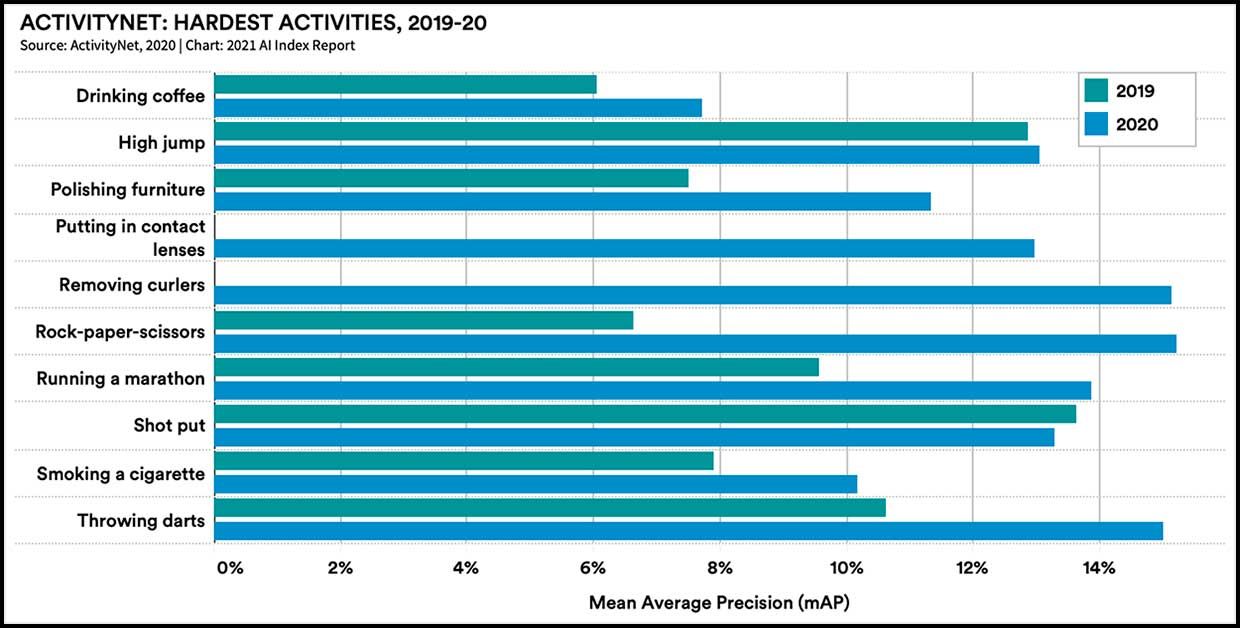
In the past years, AI has gotten really, really good at static image recognition; the next frontier in computer vision is video. Researchers are building systems that can recognize various activities from video clips, since that type of recognition could be broadly useful if ported over to the real world (think about self-driving cars, surveillance cameras, etc). One benchmark of performance is the ActivityNet dataset, which contains nearly 650 hours of footage from a total of 20,000 videos. Of the 200 activities of daily life shown therein, AI systems had the toughest time recognizing the activity of coffee drinking in both 2019 and 2020. This seems like a major problem, since coffee drinking is the fundamental activity from which all other activities flow. Anyway, this is an area to watch over the coming years.
5. Language AI Is So Good, It Needs Harder Tests

The meteoric rise of natural language processing (NLP) seems to be following the trajectory of computer vision, which went from an academic subspecialty to widespread commercial deployment over the past decade. Today’s NLP is also powered by deep learning, and Clark of the AI Index says it has inherited strategies from computer vision work, such as training on huge databases and fine-tuning for specific applications. “We’re seeing these innovations flow through to another area of AI really quickly,” he says.
Measuring the performance of NLP systems has become tricky: “Academics are coming up with metrics they think no one can beat, then a system comes along in six months and beats it,” Clark says. This chart shows performance on two versions of a reading comprehension test called SQuAD, in which an AI language model has to answer multiple choice questions based on a paragraph of text. Version 2.0 made the task harder by incorporating unanswerable questions, which the model had to identify as such and abstain from answering. It took 25 months for a model to surpass human performance on the first version, but just 10 months for one to beat humans at the harder task.
6. A Huge Caveat
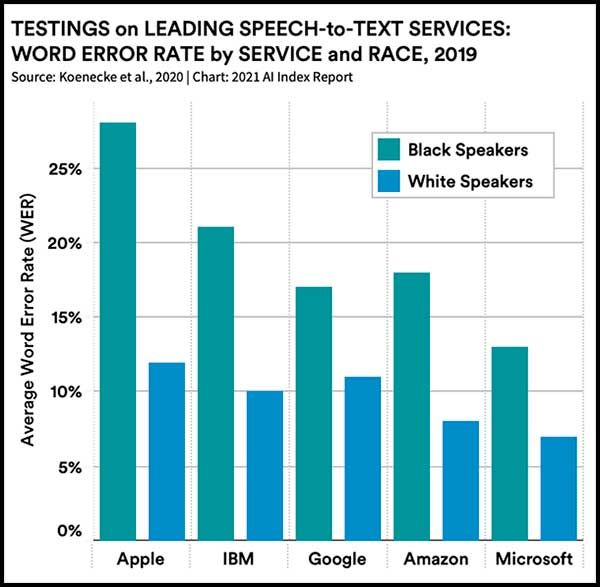
Yes, language models for tasks like speech recognition and text generation have gotten really good in general. But they have some specific failings that could derail commercial use unless addressed. Many have serious problems with harmful bias, such as performing poorly on a subset of people or generating text that reflects historical prejudice. The example here shows error rates in speech recognition programs from leading companies.
There’s a larger issue with bias here that bedevils all forms of AI, including computer vision and decision support tools. Researchers test their systems for performance, but few test their systems for harmful bias.
7. The AI Job Market Is Global
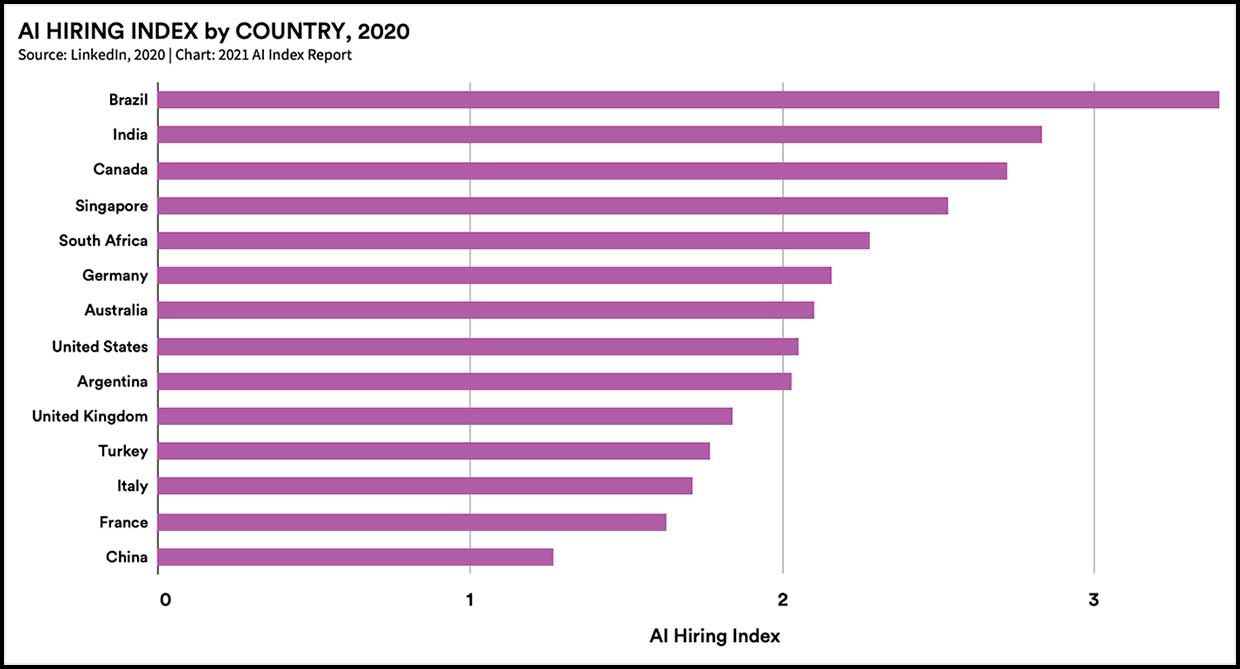
Data from LinkedIn shows that Brazil, India, Canada, Singapore, and South Africa had the highest growth in AI hiring from 2016 to 2020. That doesn’t mean those countries have the most jobs in absolute terms (the United States and China continue to hold the top spots there), but it will be interesting to see what emerges from those countries pushing hard on AI. LinkedIn found that the global pandemic did not put a dent in AI hiring in 2020.
It’s worth noting that a smaller percentage of the workforce in both India and China have profiles on LinkedIn, so data from those countries may not be fully representative.
8. Corporate Investment Can’t Stop, Won’t Stop
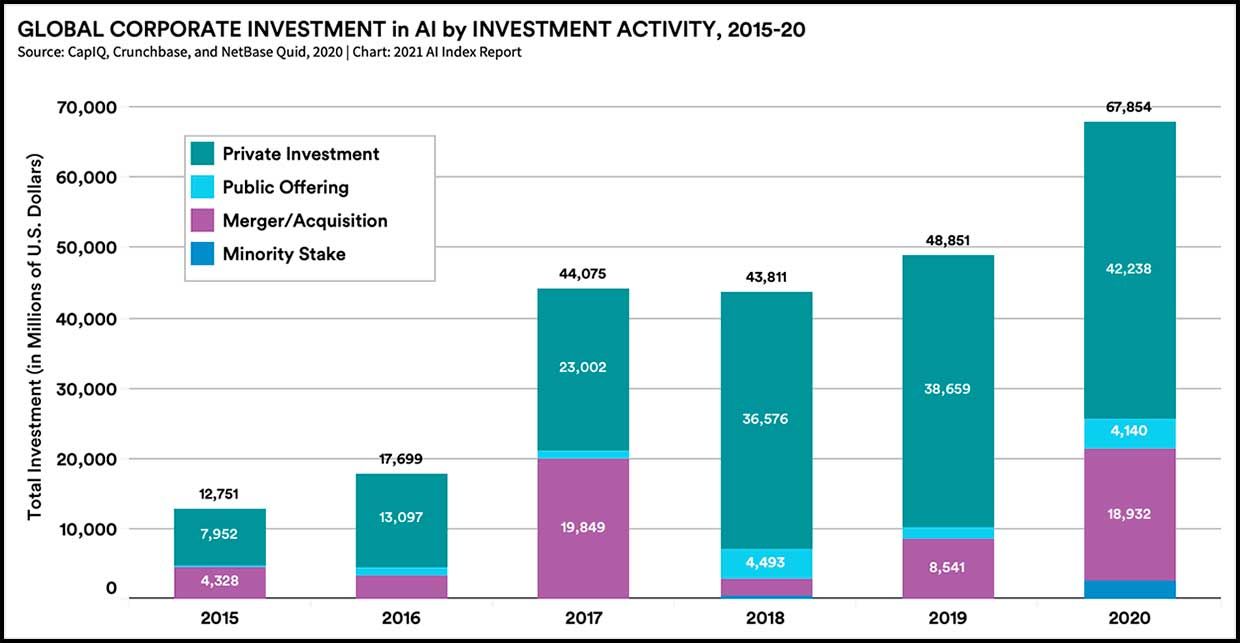
The money continues to pour in. Global corporate investment in AI soared to nearly $68 billion in 2020, an increase of 40 percent over the year before.
9. The Startup Frenzy Is Over
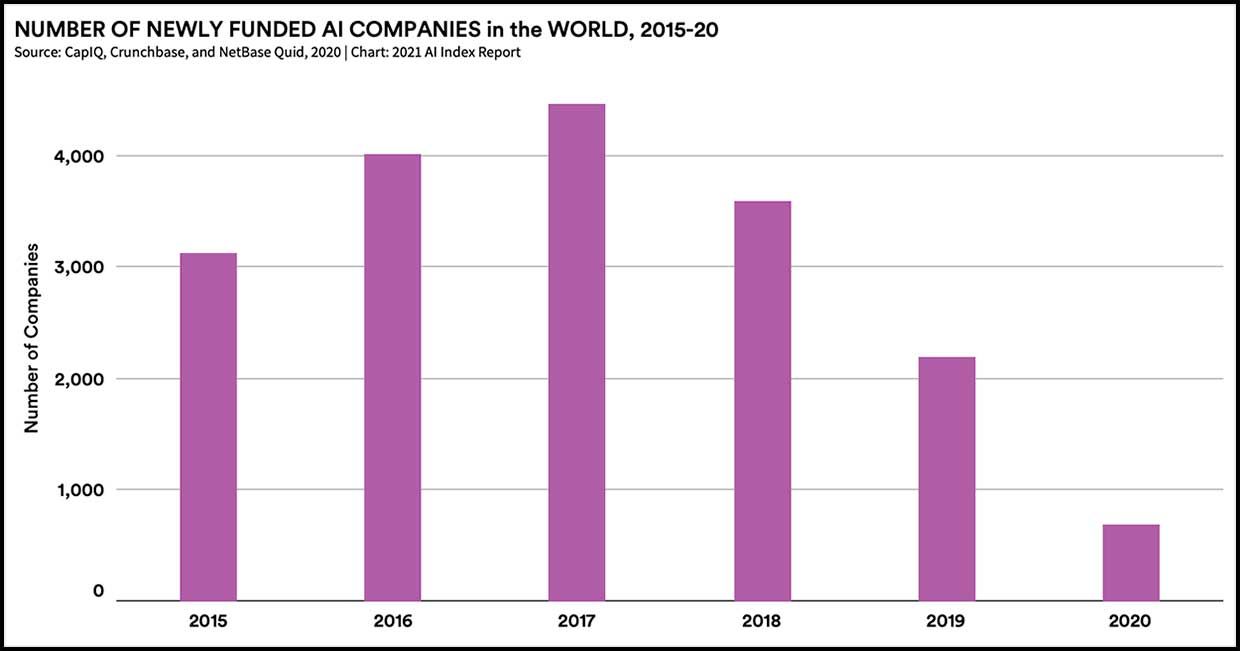
The previous graph showed that private investment is still increasing year over year, but at a slower pace. This graph shows that the money is being channeled into fewer AI startups. While the pandemic may have had an impact on startup activity, this decline in the number of startups is a clear trend that began in 2018. It seems to be a signal of a maturing industry.
10. The COVID Effect
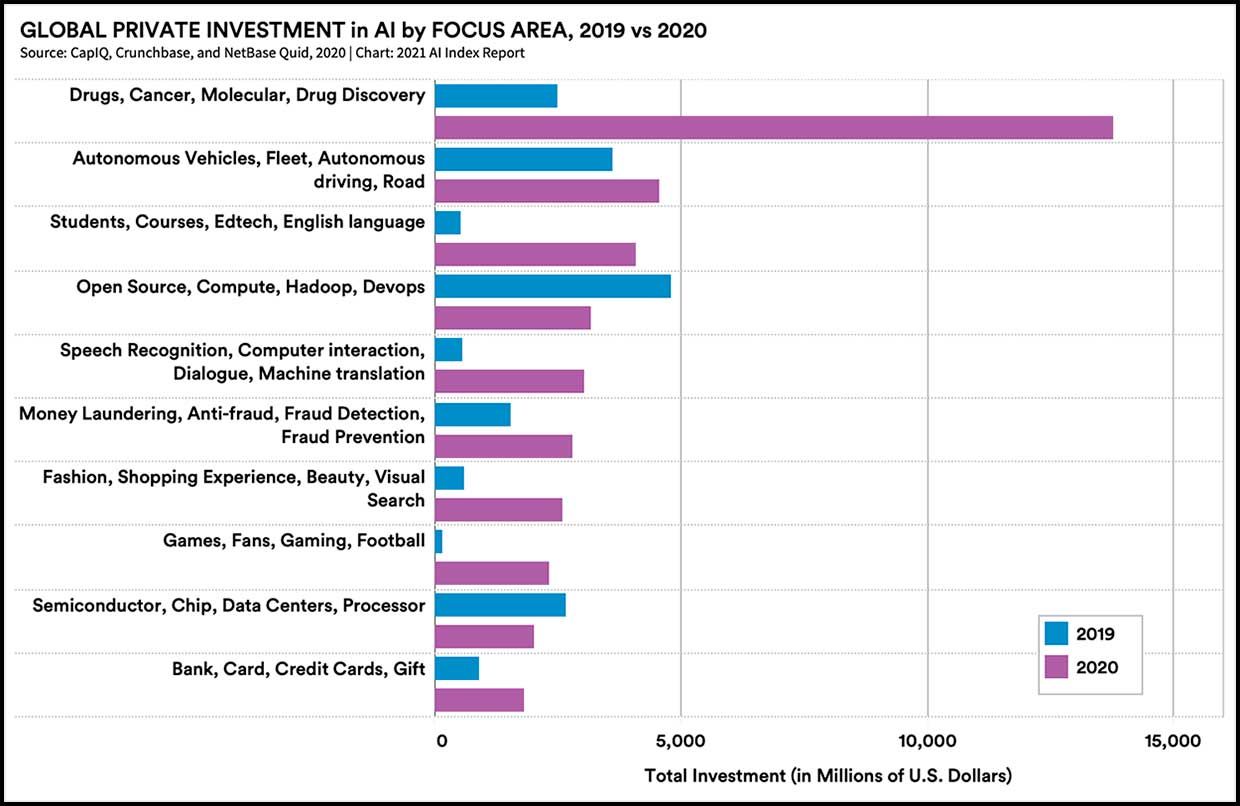
While many trends in AI were largely unaffected by the global pandemic, this chart shows that private investment in 2020 skewed toward certain sectors that have played big roles in the world’s response to COVID-19. The boom in investment from pharma-related companies is the most obvious, but it also seems possible that the increased funding for edtech and gaming has something to do with the fact that students and adults alike have spent a lot of the last year in front of their computers.
11. Risks? There are Risks?
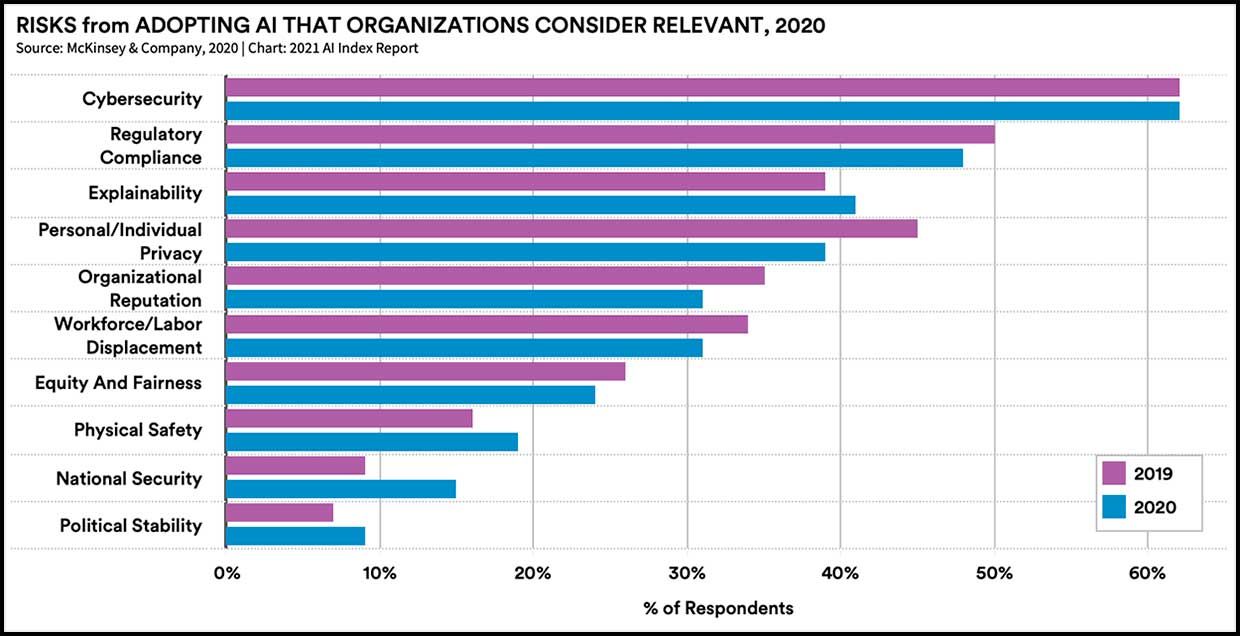
Corporations are steadily increasing their adoption of AI tools in such industries as telecom, financial services, and automotive. Yet most companies seem unaware or unconcerned about the risks accompanying this new technology. When asked in a McKinsey survey what risks they considered relevant, only cybersecurity had registered with more than half of respondents. Ethical concerns related to AI, such as privacy and fairness, are one of the hottest topics in AI research today, but apparently business hasn’t yet gotten the memo.
12. PhDs Hear the Siren Call of Industry
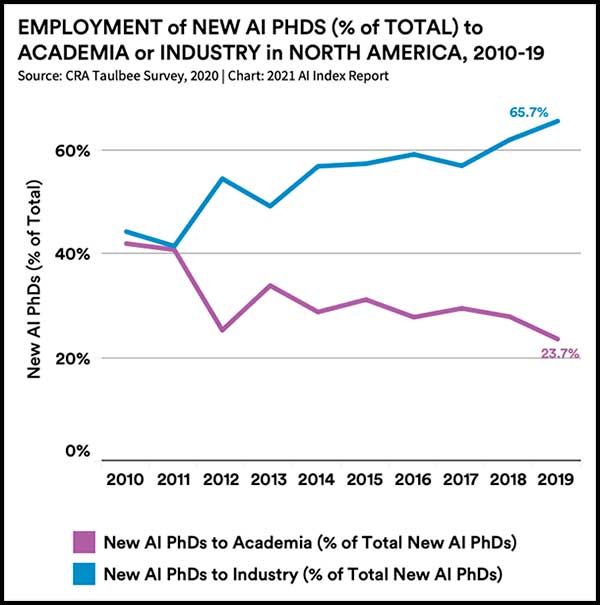
To be fair, there are only so many academic jobs. While universities have increased the number of AI-related courses on both the undergraduate and graduate level, and the number of tenure-track faculty jobs has increased accordingly, academia still can’t absorb the growing number of fresh AI PhDs released into the world each year. This chart, which only represents PhD graduates in North America, shows that the large majority of those graduates are getting industry jobs.
13. Ethics Matter
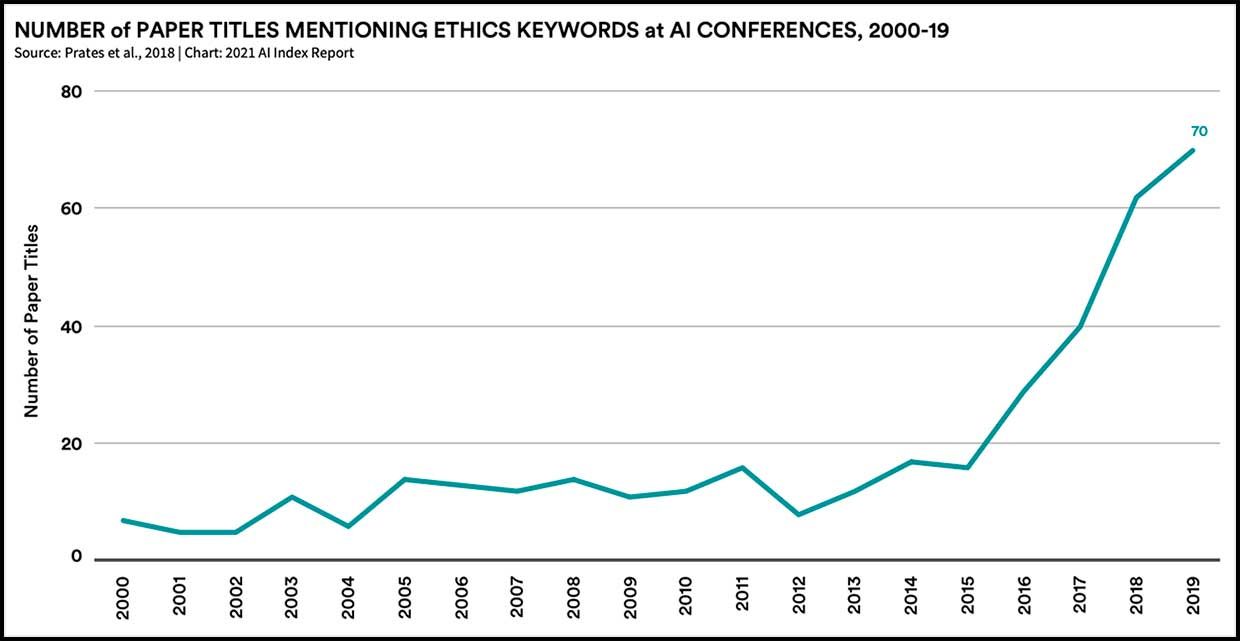
Corporations may not care about AI ethics yet, but researchers increasingly do. Many groups are working on issues such as opaque decision making by AI systems (called the explainability problem), embedded bias and discrimination, and privacy intrusion. The chart below shows the rise in ethics-related papers at AI conferences, which the AI Index’s Clark sees as an encouraging sign. Since so many students take part in conferences, he notes, “in a few years, there will be a load of people going into industry that have come up in this milieu.”
Beyond the increase in conference papers, however, there’s not much to measure. The report stresses that quantitative tests of bias in AI systems are only beginning to emerge. Creating these evaluations “feels like a new part of the AI scientific field,” Clark says.
14. The Diversity Problem, Part 1
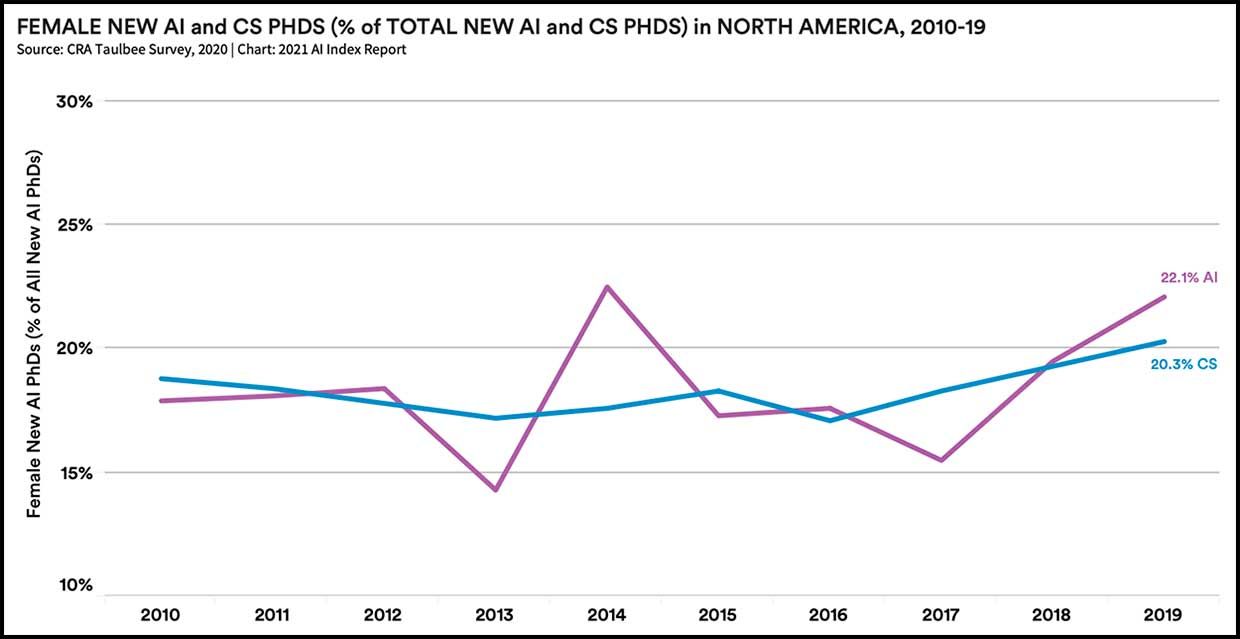
One way to work on embedded bias and discrimination in AI systems is to ensure diversity in the groups that are building them. This is hardly a radical notion. Yet in both academia and industry, the AI workforce “remains predominantly male and lacking in diversity,” the report states. This graph, with data from the Computer Research Association’s annual survey, shows that women make up only about 20 percent of graduates from AI-related PhD programs in North America.
15. The Diversity Problem, Part 2
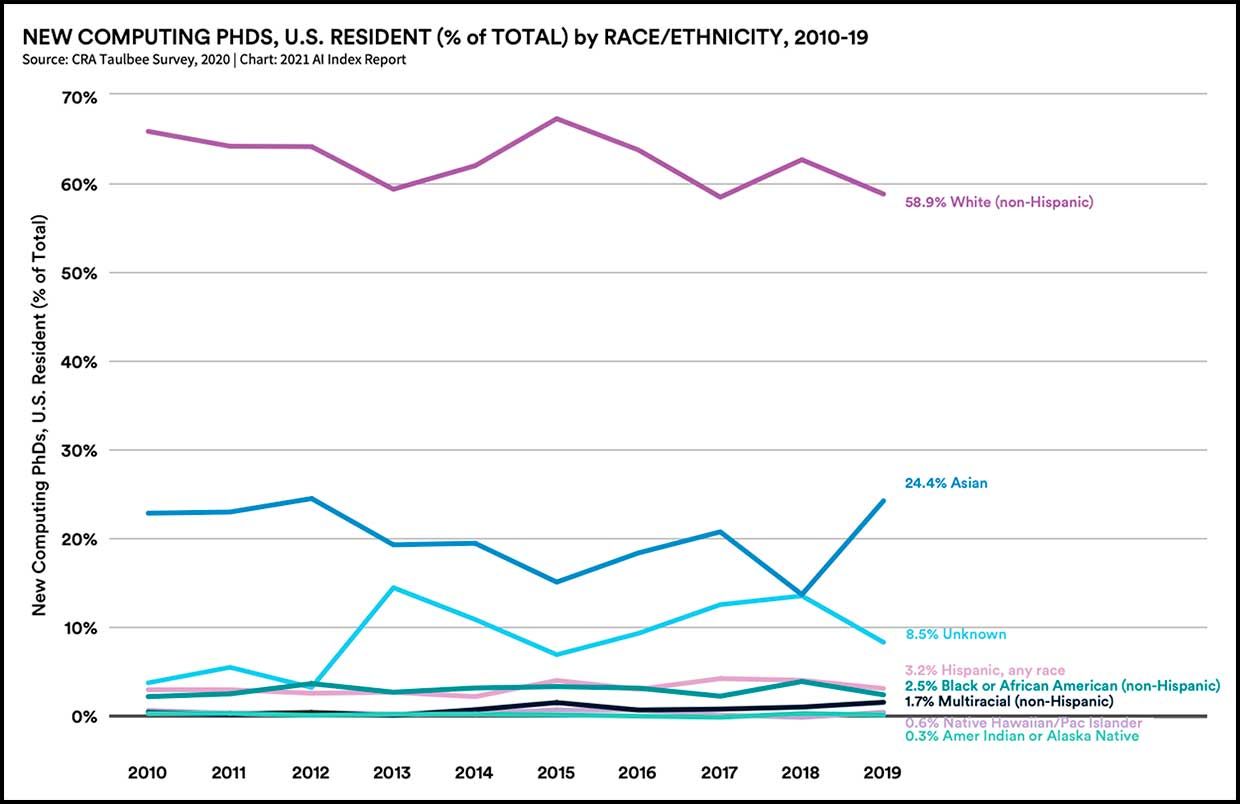
Data from that same survey tells a similar story about race/ethnic identity. What’s to be done? Well, given that the problem seems quite apparent at the level of graduating PhDs, it probably makes sense to look further up the pipeline. There are any number of excellent STEM programs that focus on girls and underrepresented minorities. AI4ALL comes to mind. Maybe sling them a few dollars, or get involved in some way?
This article has been published from the source link without modifications to the text. Only the headline has been changed.


