Data Collection
This section details the various aspects involved in collection of smart contract data from the Ethereum main-net including the problems faced, solutions employed and data statistics.
The challenges in Smart Contract Data Collection
Even though Ethereum is a public blockchain which means that all the data is available publicly to anyone who connects to the network, there were a few challenges that we faced –
• The Ethereum data has grown in size over the years, with its size crossing 1TB in May, 2018. To have access to all the data, we have to run a ’full’ node which is both time and space consuming with full node sync times increasing drastically over the last few years.
• The next issue was finding which were the smart contract addresses in the Ethereum network. Simply brute-forcing address (1640 possibilities) was infeasible.
Smart Contract Bytecode Collection
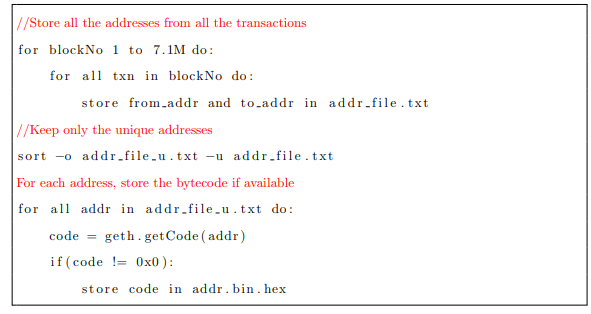
To deal with the problem of running a full node, we leveraged INFURA API (by Consensys) and leveraged it’s geth-like methods and Web3 to get the byte-codes of the on-chain contracts. To tackle the problem of finding the smart contract addresses, we went through all the transactions from the genesis block till block number 7.1M (mined on 20 January, 2019), found all the addresses and used the getCode() method provided by geth to find if it was a smart contract address or not.
//Store all the addresses from all the transactions
The trade-off with this approach is that we do not get the contracts without any normal transactions recorded on the blockchain or which have been killed. Therefore, only live and interacted-with atleast once contracts are collected by our methods.
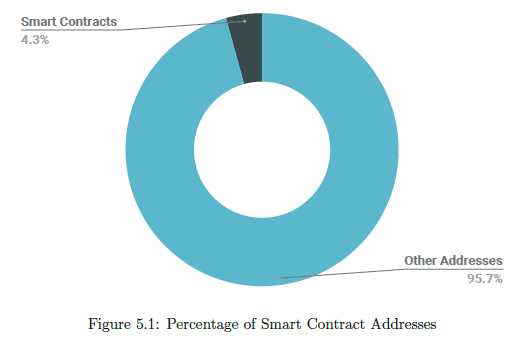
However, as the search space was huge, the network quickly became a bottleneck. Therefore, we spread out this data collection activity to Google Compute Engine instances. In total, our scripts traversed 380M transactions over 7.1M blocks. The total number of unique addresses we found in those transactions was 44M, and out of those only 1.9M addresses were found to contain smart contracts. The byte-codes of these 1.9M smart contracts was stored.
Source Code Collection
Etherscan has a utility called verify source code, using which smart contract developers can publish the source-code of the smart contract. The utility takes the source code, compiler version, optimization parameters, libraries, etc. and compiles the given source-code with the provided parameters. If the resulting bytecode matches that present on the chain, the source code is verified successfully and is published on Etherscan’s website.
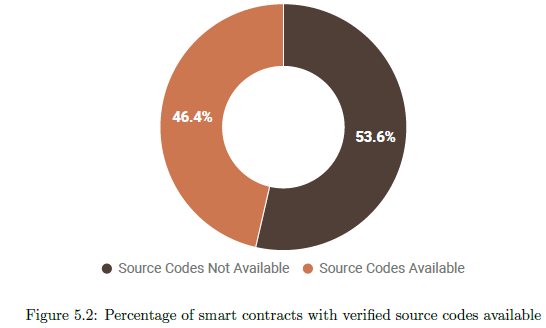
We utilized Etherscan’s API to get the source codes of all the 1.9M smart contracts. Our scripts found 887K (46.4%) smart contracts with source codes available.
Analysis of the collected on-chain contracts
Duplicity
Code reuse is a common practice in many applications and Smart Contracts are no exception. As a matter of fact, many real world access control vulnerabilities (like Rubixi) have arisen because of improper copy-pasting i.e. not changing the constructor name when the contract name was changed, leading to anyone becoming the owner of the contract.
Therefore, we suspect that our on-chain data-set also has duplicates. For the purpose of our study, we define two contracts to be duplicates of each other if they have the exactly same deployed bytecode on the blockchain. To find duplicates, we use an approach similar to [65] – Take the bytecode of every contract, calculate the MD5 hash, and only keep the contracts with a unique MD5 hash.
In the bytecode data set, it is observed that only 103K (or 5.4%) of the 1.9M bytecodes are unique. Similar results are observed for the solidity data-set with only 42K (or 4.7%) of the 887K contracts
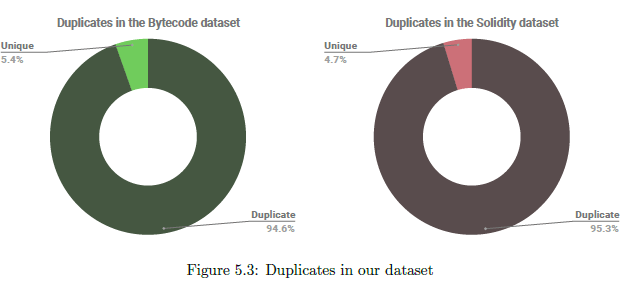
having unique bytecode. This indicates a very high re-usability in smart contract development and further highlights the importance of having good security practices as if one smart contract is vulnerable, all its duplicates are vulnerable too. On the positive side, the number of contracts to be secured is drastically lower that previously imagined. Therefore, using tools that report vulnerabilities by formal methods (like Zeus) can be viable option.
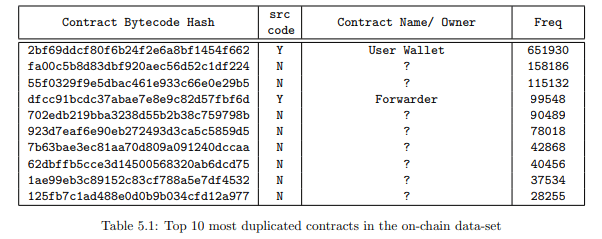
Table 5.1 shows the top ten most duplicated contracts in the data-set. The most duplicated contract is a User Wallet contract that has been deployed over 651K times. However, only two out of the top ten duplicated contracts have verified source codes available. This is highly suspicious as it is unlikely that a contract is being replicated so many times without it’s source code being available.
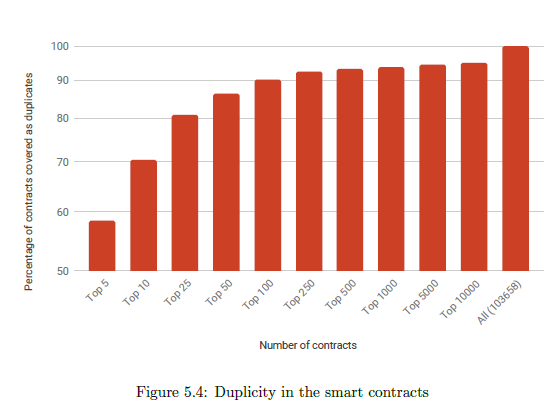
Figure 5.4 plots the number of contracts (in sorted order of most duplicates) and the corresponding
percentage of the total data-set they cover. It is observed that the top hundred contracts (0.1% of the data-set) amount to a total of 90.28% (or 1.72M occurrences) of the data-set. We call these hundred contracts High Occurrence Targets.
Ether Balance
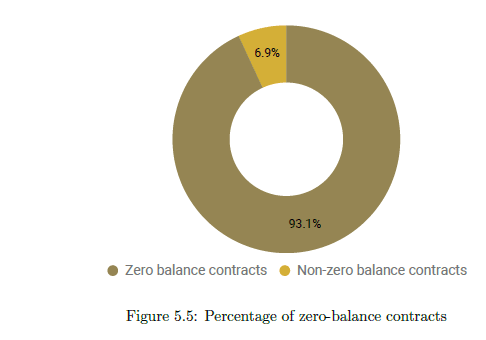
Every address (contract or normal) has an associated balance with it. For all the 1.9M contract addresses in our data-set, we leverage geth’s getBalance() method to find the ether balance. We find that the collected contracts contain a total of 10.88M Ether (worth roughly US$1.66B ). However, 93% (or 1.77M) of the contracts had zero balance. The most valuable contract is
Wrapped Ether (WETH9) with roughly 2.4M Ether (worth roughly around US$367M). This contract essentially wraps your Ether into wETH that can be further used to trade with other ERC-20 compliant alt-coins. This single contract holds nearly 22% of all the ether in contracts.
Table 5.2 shows the most valuable contracts in our dataset after considering duplicates. We
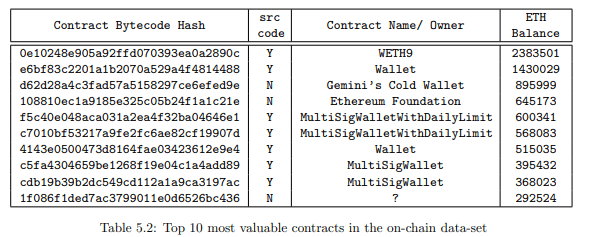
see that contracts like MultiSigWalletWithDailyLimit and MultiSigWallet appear more than once. This is because even though they are similar contracts, they have been compiled using different solc versions, and therefore generate unique bytecode. Also, as expected we observe that wallet contracts store the most amount of Ether.
Figure 5.6 plots the number of contracts (sorted in non increasing order of ether balance) and the
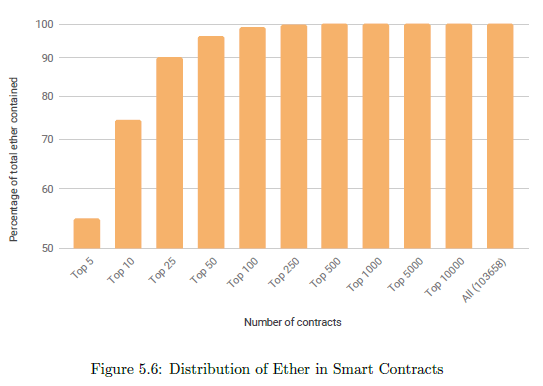
corresponding percentage of the total ether-value they cover. It is observed that the top hundred contracts (0.1% of the data-set) amount to a total of 98.86% of the total ether-value in smart contracts (or 10.7M ETH). This ether is worth around US$1.6B.
We call these hundred contracts High Value Targets.
Number of Transactions
Another metric we looked into when analysing the on-chain data-set is the interactions other addresses and contracts on the network have with that smart contract. For that we looked at the number of transactions each contract was involved in. More the number of transactions for a contract, more it’s interaction with others in the network and more it’s security impact as well. As before, we also take care of duplicates in our analysis and only consider the total across a particular duplicate group.
We observe that smart contracts in our data-set were present at either the sending or the receiving end in 175M transactions (which is roughly 46% of all the transactions we went through). Therefore almost 1 in 2 transactions involves a smart contract. This further highlights the importance of having secure contracts.
It is also worth noting that 434K contracts (22.7%) had only one recorded transaction on the blockchain (most likely the contract creation transaction).
The single contract with the most number of transactions is EtherDelta with 5.2M transactions,
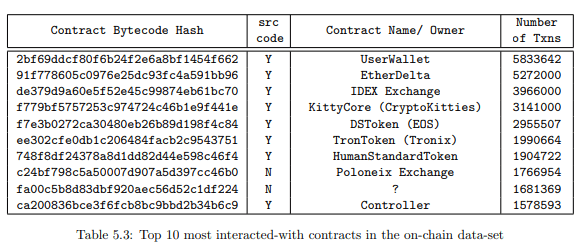
while the contract group (after considering duplicates) with the most number of transactions is UserWallet with 5.8M transactions.
Figure 5.7 plots the number of contracts (in non-increasing order of number of transactions) and the corresponding percentage of the total transactions done by smart contracts that they cover. It is observed that the top 2500 contracts (2.5% of the data-set) amount to a total of 90.37% of the total smart contract transactions (or 158M transactions).
We call these 2500 contracts High Interaction Targets.
Value of Transactions
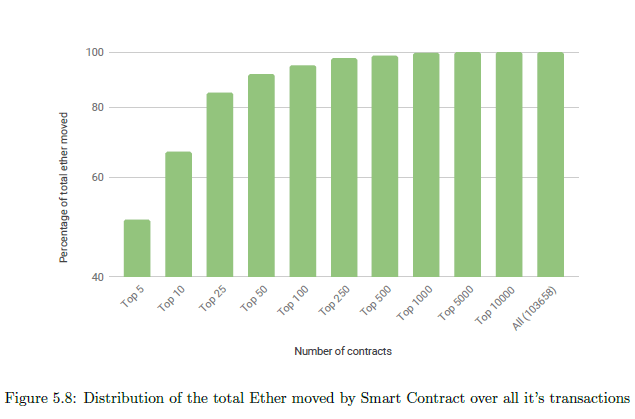
For each of the 1.9M contracts in our data-set, we also calculated the total value of transactions (in ETH) that it was involved in (on either side of the transaction). This gave us an idea of which

contracts were involved in moving the crypto-currency across the network. Smart Contracts in our data-set have been involved in transactions valuing 484M ETH worth around US$73B. Interestingly, 877K contracts (45.9%) have not been involved in any transaction involving ether.
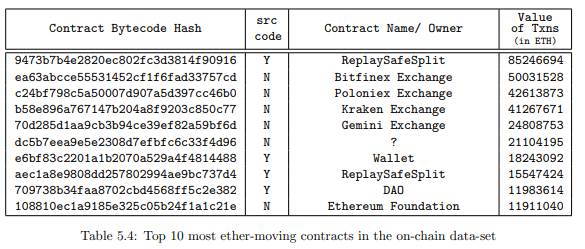
Figure 5.8 plots the number of contracts (in non-increasing order of the total ether moved) and the corresponding percentage of the total ether moved done by smart contracts. It is observed that the top 100 contracts (0.1% of the data-set) have moved a total of 459.4M ETH (94.89% of the total ether moved by smart contracts). This ether is valued at US$69.89B. We call these hundred contracts High Ether Moving Targets.
Contract Creation Analysis
Next we move our analysis to the contract creation transaction for every contract in our data-set. For all the 1.9M contracts we find the transaction which created the contract. However, this leaves us with many contracts without any creation information. After further investigation we realized that many contracts in our data-set have been created by ’internal’ transactions and are therefore not present on the blockchain. Therefore, to get their information we leverage Etherscan’s API to get the internal transaction information as well. Finally, we were able to get the contract creation information of all the 1.9M contracts.
Figure 5.9 shows the distribution of the contract deployment mechanisms in our data-set. Surprisingly 60.6% of our data-set has been deployed by contract internal transactions.
Interestingly, 60.6% of our data-set has been deployed by contract internal transactions. Interestingly, we also observed that for many addresses, the contract creation transaction was not the first transaction(or internal transaction) for that address. This happened 760 times for contracts deployed using normal transactions and 6 times for contracts deployed using internal transactions. This is because the Ethereum Virtual Machine has no way to check the validity of a particular address and ether may be sent to an address which is not yet claimed by any individual or smart contract. Common reasons for such anomalies seem to be pre-funding of smart contracts and mistakes by the developers.
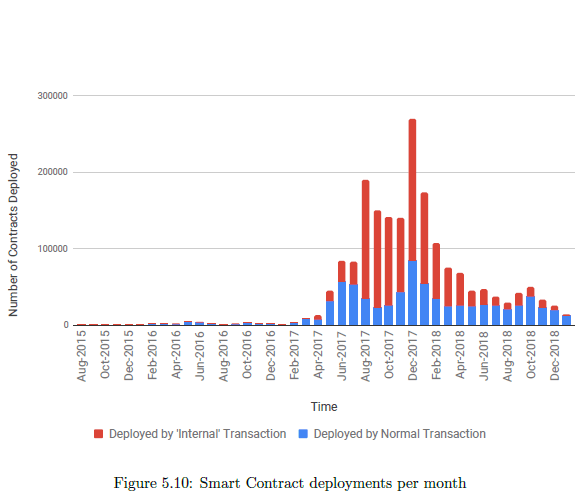
Figure 5.10 shows the deployment of smart contracts over-time. We see that the trend closely resembles the price graph of crypto-currencies like Bitcoin and Ethereum with a surge near the end of 2017 and interest slowing down after that.
We observed that the average gas used for contract deployment is 318K gas. Also, the oldest

contract in our data-set is 0x6516298e1C94769432Ef6d5F450579094e8c21fA which was deployed on 7th August, 2015.
Next, we look at the addresses and the contracts which are involved in deploying these contracts –
• Out of the 753K contracts deployed using normal transactions, we find that they have been deployed by only 57,600 accounts on the blockchain. The actual number may be far less than this as there is no restriction on the number of accounts an individual can own. The top ten contract creating addresses are listed in Table 5.5. We also observe that these top ten accounts don’t create many new contracts, with most of them being exact duplicates.
• Out of the 1.16M contracts deployed using internal transactions, it is observed that these contracts have been deployed by only 9228 contracts. When we consider the duplicate creatorcontracts as one, this number further reduces to 2420 contracts
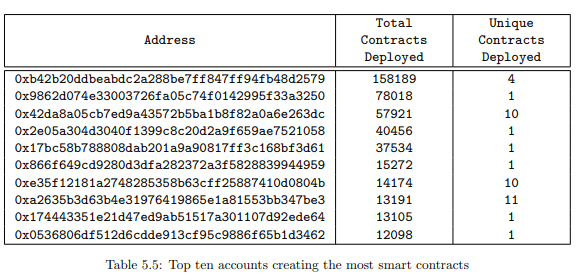
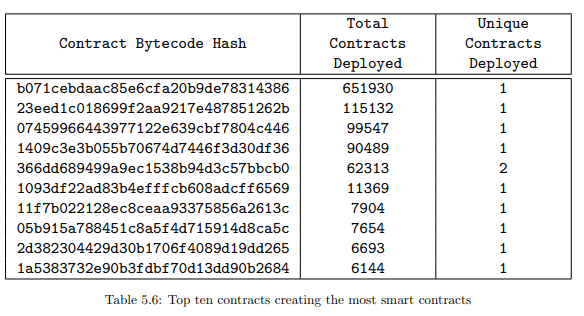
Table 5.5 and Table 5.6 give some insights into where so many duplicate contracts are coming from. It was expected that similar contracts create similar child contracts, however we also observe that there are very few addresses (both account and contract addresses) which are responsible for the bulk of contract creation on the blockchain.
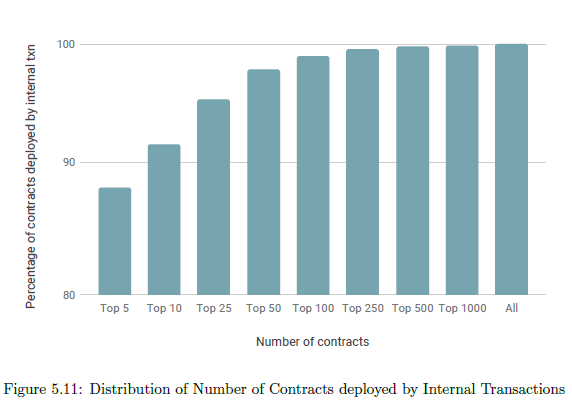
Figure 5.11 plots the number of contracts (in non-increasing order of the number of contracts deployed) and the corresponding percentage of the total number of contracts deployed. It is observed that the top 100 contracts have deployed 1.14M contracts (98.93% of the total contracts deployed by internal transactions).
We call these hundred contracts High Origin Targets.
Summary
We have analysed the on-chain smart contracts across various different parameters and we observe that a very small number of contracts are the most ‘important’ for each category. Finally we collect:
• 100 High Ether Moving Targets,
• 100 High Occurrence Targets,
• 100 High Origin Targets,
• 100 High Value Targets and,
• 2500 High Interaction Targets
These 2900 (2715 unique) smart contracts are called ‘Contracts of Importance’. Solidity files are available for 2053 (70%) of these contracts.
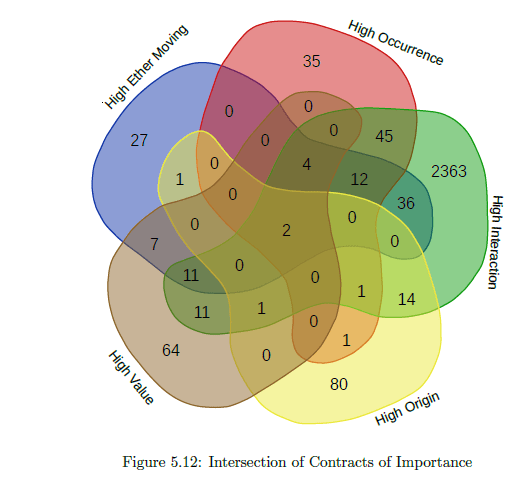
Figure 5.12 shows the intersection across the various categories. The high origin and high value contracts are the most independent, with there being significant overlap across the other categories. Surprisingly, we observe that two contracts are present across all the five categories.
Security Analysis of On-Chain Contracts
Experiments with Different Tools
Static Analysis Tools
• SmartCheck
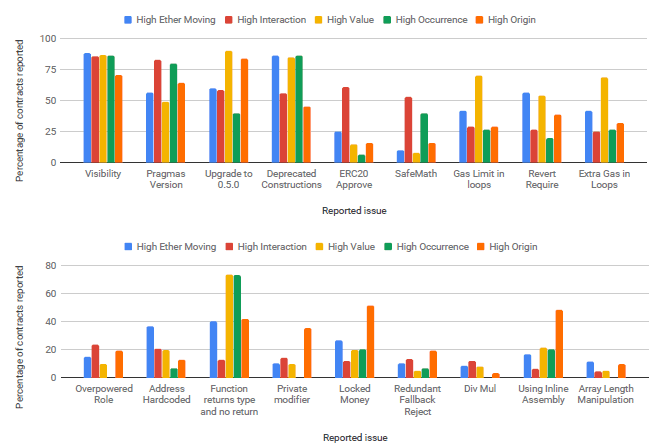
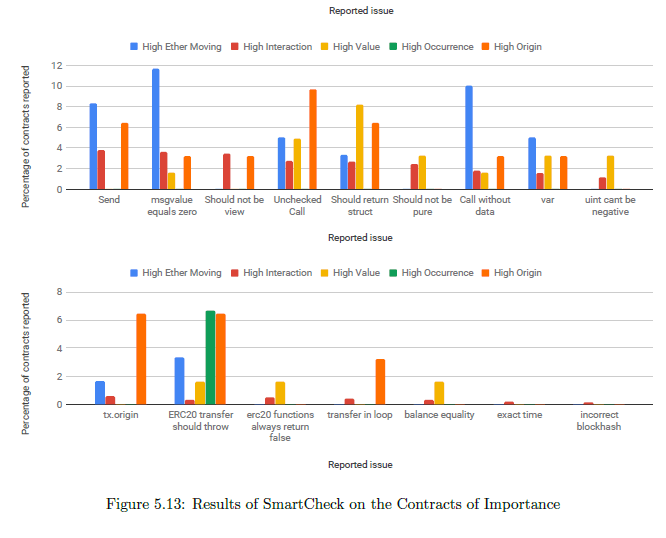
Figure 5.13 shows the percentage of contracts reported as vulnerable by SmartCheck across the different categories it uses. Visibility issues, floating pragmas, old solidity versions, deprecated constructions are the most common vulnerabilities that are reported across all the five smart contract categories. High origin contracts are more vulnerable to locked money, inline assembly usage, unchecked call and tx.origin than the other contracts.
• SolMet
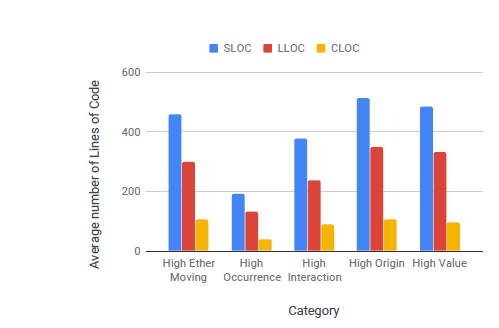
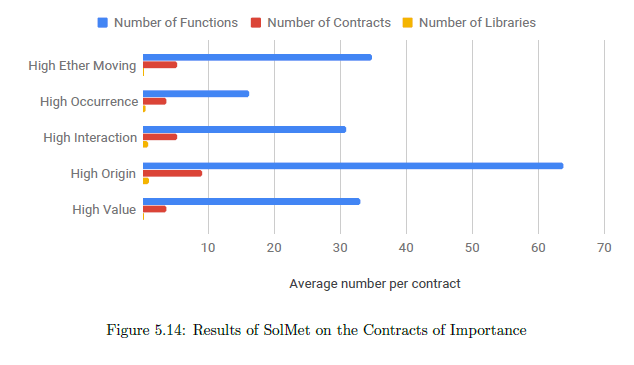
Figure 5.14 shows some of the important results of SolMet on our Contracts of Importance. SLOC denotes the Source lines of Code, LLOC is the Logical lines of Code and CLOC is the comments line of code. Across all the categories, we observe relatively smaller files (< 400 LLOC). Also, we observe good commenting practices (nearly 1 in 3 logical lines have a comment). Therefore, readability of contracts whose source code is available should not be an issue.
We also observe, that per solidity file, the high origin contracts have the maximum number of functions and contracts. This is expected as they have to contain the code of the contracts they create as well. The use of libraries is low with high origin and high interaction contracts averaging at nearly one library per contract file.
Symbolic Execution Tools
• Oyente
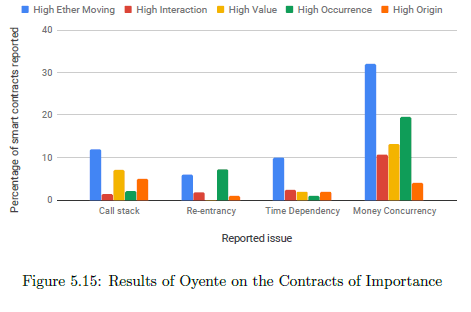
Oyente is one of the oldest security tools for Ethereum smart contracts. The average EVM code coverage with Oyente was reported to be 67.81%. As shown in figure 5.15, money concurrency is the biggest issue in the contracts of importance, followed by time dependency and re-entrancy. Also, Oyente did not detect any overflows and underflows, like on the benchmark.
• Securify
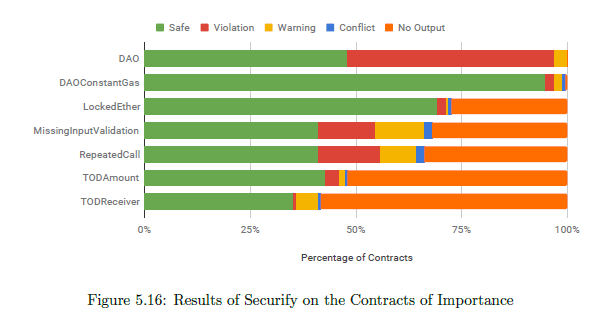
Securify is the only tool which marks the contract as safe too. The results of Securify on the contracts of importance as a whole are shown in in figure 5.16. DAO (re-entrancy) is the most prominent vulnerability reported, followed by missing input validation and repeated call. For markers like unrestricted Ether flow and unrestricted write, Securify did not give an output for more that 93% of the contracts and are therefore not shown in the graph.
• Mythril
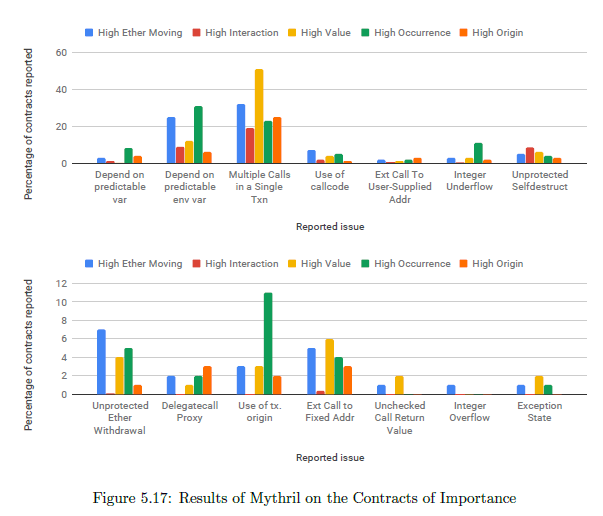
The results on Mythril show that multiple calls in a single transaction (which might lead to a denial of service attack) and dependence on predictable environment variable (bad sources of randomness) are the major vulnerabilities. However, critical issues like unprotected selfdestruct, unprotected Ether withdrawal, use of tx.origin also appear quite frequently. Also, since the tool was getting stuck on some contracts (for more than the day), the analysis was done by setting the max-depth parameter to 10.
5.3.2 Analysis
The experiments for this section were carried out on Google Compute Engine n1-highmem-8 instances with 8 vCPUs and 52GB RAM.
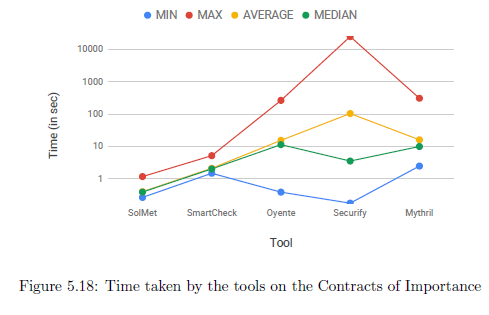
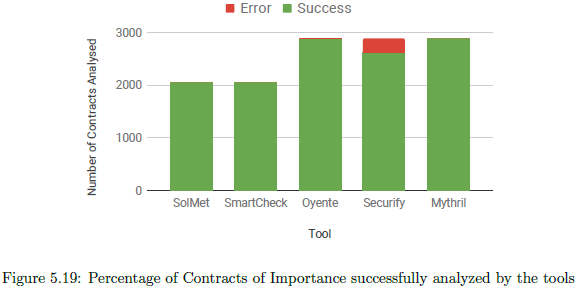
Figure 5.18 demonstrates the time taken by various tools on the ‘Contracts of Importance’. As expected, static analysis tools work much faster that symbolic execution tools. We also observe a larger gap between the maximum, minimum, average and median times for these tools. Figure 5.19 shows that all tools (except Securify and Oyente on some instances) are able to analyse the Contracts of Importance successfully.
We also observe the following –
• Smart contracts are generally not too long. The use of libraries is less. However, one smart contract file usually contains more than one contract (roughly five on average). Therefore, tools should be cognizant of this fact when analyzing.
• Many of the on-chain contracts have become old (using outdated compiler versions or deprecated constructions). Also poor coding practices like costly loops, hard-coded addresses, using inline assembly frequently occur in the on-chain contracts
• There is a good chance that vulnerabilities like re-entrancy (DAO), transaction order dependence, bad randomness, unprotected selfdestruct might still exist in these contracts.
Summary
In this section we have shown how the on-chain smart contracts were collected. We then analyse the smart contracts across different categories – duplicity, high ether balance, high number of transactions, etc. Surprisingly, we observe that only a small fraction of the contracts dominate each category that we analysed. This points to the smart contract space being not so decentralized. We observe that even though there are no banks, the exchanges and wallet contracts take their place. Therefore it becomes even more crucial to check these contracts and make sure that they are secure. For further analysis, we identified Contracts of Importance – a collection of the most important contracts from each of the categories that we studied.
We further study these contracts of importance using the different tools. We observe that most of the contracts are older and the biggest issue seems to be improper coding practices. The security tools also identified vulnerabilities in these contracts. However, if any of the warnings is true, it can be quite disastrous as these contracts dominate the blockchain. Any security flaw in these contracts will likely become a big issue. We also observe that the size of the contracts (in lines of code) is quite small as compared to normal large pieces of software. Therefore, using more intensive security auditing techniques and practices should not be a big issue.
This article has been published from the source link without modifications to the text. Only the headline has been changed.
Source link


