Big data, AI, machine learning, and numerous others are all buzzwords we seem to throw around lightly in recent years. Even though they are hugely different from one another, they all have one thing in common. Data! Huge amounts of data that need to be managed.
The downside of that is that the more data you have the more of a headache it is to store, query, and make sense of.
However, running Elasticsearch on Kubernetes can save you a lot of trouble. Elasticsearch handles storing and querying data, while Kubernetes handles the underlying infrastructure. By the end of this tutorial, you will have a running Elasticsearch cluster on Kubernetes, learn best practices to leverage the platforms’ powers, and get some tips about memory requirements and storage.
What is Elasticsearch?
Elasticsearch is a datastore that stores data in indices. It’s also a real-time, distributed, and scalable search engine which allows for full-text and structured search, as well as analytics. It’s great for storing and searching through large volumes of textual data, like logs, but can also be used to search many different kinds of documents.
We at Sematext are running a huge Elasticsearch cluster on Kubernetes that handles millions of data points per minute from ingested logs, metrics, events, traces, etc.
To learn more about Elasticsearch, check outthis Elasticsearch guide.
What is Kubernetes?
Kubernetes is the de-facto standard container orchestrator and by far the easiest way to run and manage clusters in the cloud or on-premises. But what is a container orchestrator? To understand Kubernetes, you first need to understand Docker.
Docker is a container engine that lets you create ephemeral containers to run your applications. These containers are stateless and run isolated from the rest of your system. Running Docker containers is the same across any operating system, as long as the hosts are in a Kubernetes cluster. You don’t have to worry about the underlying infrastructure at all. This makes packaging and shipping apps to production simple.
However, containers are useless without a cluster and orchestrator to run and manage them. Kubernetes manages all of this and does the heavy lifting so you don’t have to. What you have to do is tell Kubernetes what to do through the kubectl command line and with yaml resource files.
Why Run Elasticsearch on Kubernetes
Elasticsearch can store huge amounts of textual data with the ability to quickly search through it when needed. It’s deployed in clusters, at least consisting of three nodes. These nodes have throughout the years often been VMs that you would spin up and then handle connections between them. It’s tiresome and hard to manage.
Kubernetes has stepped in to solve that issue. It has become the de-facto standard for running high-uptime and reliable systems in the cloud and on-premises. Even though Kubernetes is designed to run ephemeral, stateless, apps and not databases, there are upsides of running an Elasticsearch cluster on Kubernetes. You should generally not be running databases on Kubernetes, but you can. Handling persistent data is simple by using persistent volume claims and stateful sets.
With Kubernetes, you get a cluster that’s easier to configure, manage and scale. Once you configure your Elasticsearch cluster on Kubernetes, the process of deploying it to another cloud provider or on-premises is incredibly simple.
Kubernetes is also very developer-friendly. You rely on infrastructure as code configurations and not manually setting up and configuring infrastructure. For many, this may be the only way they know how to deploy a large cluster. Seeing as many teams don’t have dedicated DevOps engineers and they have to rely on their developers to handle the infrastructure, you may be saving yourself a huge headache by letting Kubernetes manage the cluster.
Let’s check out the architecture behind running Kubernetes and Elasticsearch.
Kubernetes Architecture: Basic Concepts
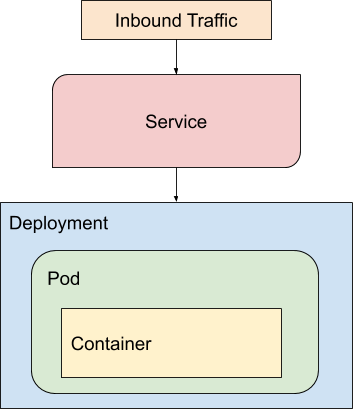
Kubernetes manages your application with several different resource types. First, your application is built and packaged into a Container. This containerized application is deployed to Kubernetes and runs within a Pod.
Kubernetes Pods are grouped in a Deployment. A Deployment is a key concept in Kubernetes that manages Pods and their properties, like how many replicas of each Pod to run.
A Service is then used to expose the Deployment to the Internet. If it is of type LoadBalancer it’ll also load balance requests evenly across all the Pods in the Deployment. Simply put, a Service creates a single IP address which is used to access the Containers. Services can also make Pods accessible to other Pods within the Kubernetes cluster.
Kubernetes Nodes are the virtual machines on which the Kubernetes cluster is running, including all Pods. Pods are always ordered randomly across the Nodes. You can use Affinity and Anti-Affinity rules to tell Kubernetes how to spread the running Pods across the Nodes. Maybe you want Elasticsearch Pods to only run on certain Kubernetes Nodes.
Deployments do not keep state in their Pods. It’s assumed the application is stateless. If you need your application to maintain state, like in our case with Elasticsearch, then you need to use a StatefulSet.
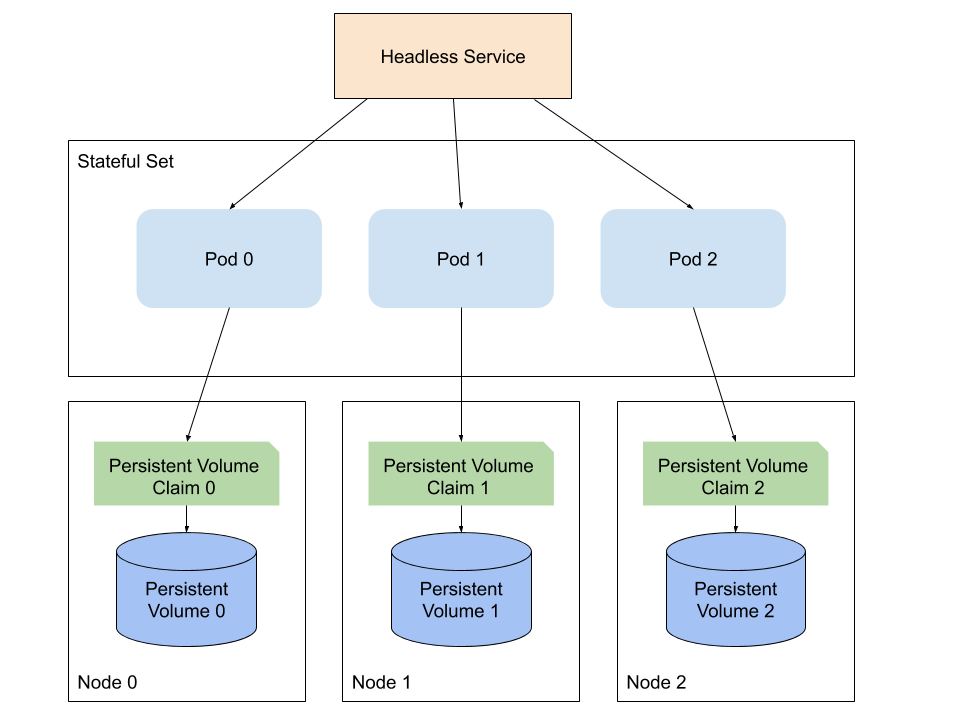
A StatefulSet is a Deployment that can maintain state. Makes sense from the name right?
When using StatefulSets you also need to use PersistentVolumes and PersistentVolumeClaims. A StatefulSet will ensure the same PersistentVolumeClaim stays bound to the same Pod throughout its lifetime. Unlike a Deployment which ensures the group of Pods within the Deployment stay bound to a PersistentVolumeClaim.
A PersistentVolume (PV) is a Kubernetes abstraction for storage on the provided hardware. This can be AWS EBS, DigitalOcean Volumes, etc.
A PersistentVolumeClaim (PVC) however is a way for a Deployment or StatefulSet to request some storage space from a PersistentVolume. This allocated storage is persisted even if Pods and Nodes restart.
Alongside StatefulSets you have Headless Services that are used for discovery of StatefulSet Pods.
A Headless Service is a service when you don’t need load-balancing and a single Service IP. Instead of load-balancing it will return the IPs of the associated Pods. Headless Services do not have a Cluster IP allocated. They will not be proxied by kube-proxy, instead Elasticsearch will handle the service discovery.
Elasticsearch Deployment: Cluster Topology
Elasticsearch should always be deployed in clusters. Every instance of Elasticsearch running in the cluster is called a node. In Kubernetes an Elasticsearch node would be equivalent to an Elasticsearch Pod. Don’t get it confused with a Kubernetes Node, which is one of the virtual machines Kubernetes is running on. For the rest of this Elasticsearch Kubernetes tutorial I’ll use the term Elasticsearch Pod to minimize confusion between the two.
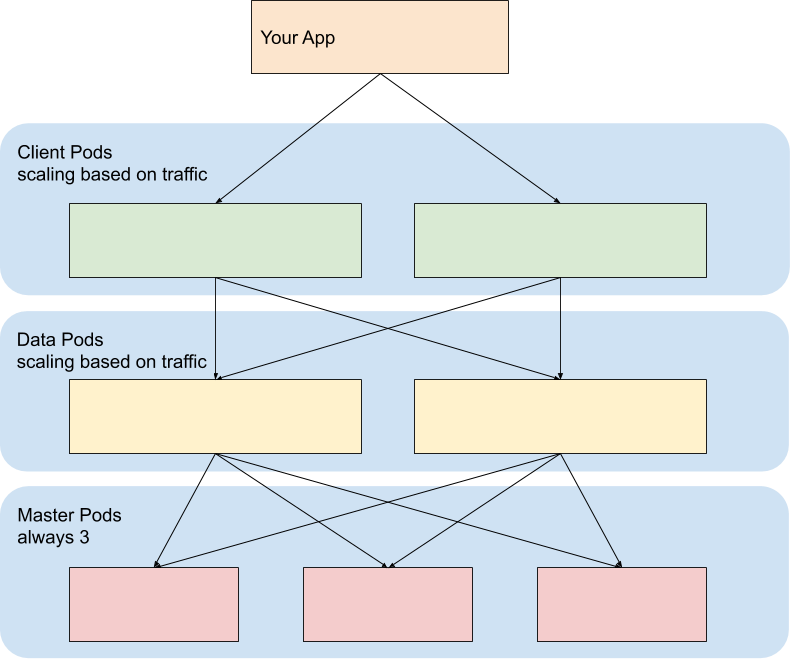
By default, when you deploy an Elasticsearch cluster, all Elasticsearch Pods have all roles. The roles can be master, data, and client. The client is often also called coordinator. Master Pods are responsible for managing the cluster, managing indices, and electing a new master if needed. Data Pods are dedicated to store data, while client Pods have no role whatsoever except for funneling incoming traffic to the rest of the Pods.
You need a minimum of three master-eligible Pods to avoid split-brain when a new master needs to be appointed. You set this role for a node by having this combination of roles.
roles:
  master: "true"
  ingest: "false"
  data: "false"
Regarding data Pods, you need at least two. They will persist data, receive queries, and index requests. Basically, they do all the heavy lifting. You set this role like this.
roles:
  master: "false"
  ingest: "false"
  data: "true"
Client Pods are also known as Coordinating Pods. You should have two of these as well. These Pods are exposed to consumers of the cluster data and serve as HTTP proxies. If they are not deployed, Data Pods will serve as coordinating Pods. Avoid this on larger clusters. You set a Pod to be a client by having all roles false.
roles:
  master: "false"
  ingest: "false"
  data: "false"
This setup is considered best practice and scaling up would be needed only when the current node count is insufficient. Luckily, scaling up an Elasticsearch cluster on Kubernetes is as simple as running one command.
This is what the final cluster topology will look like.
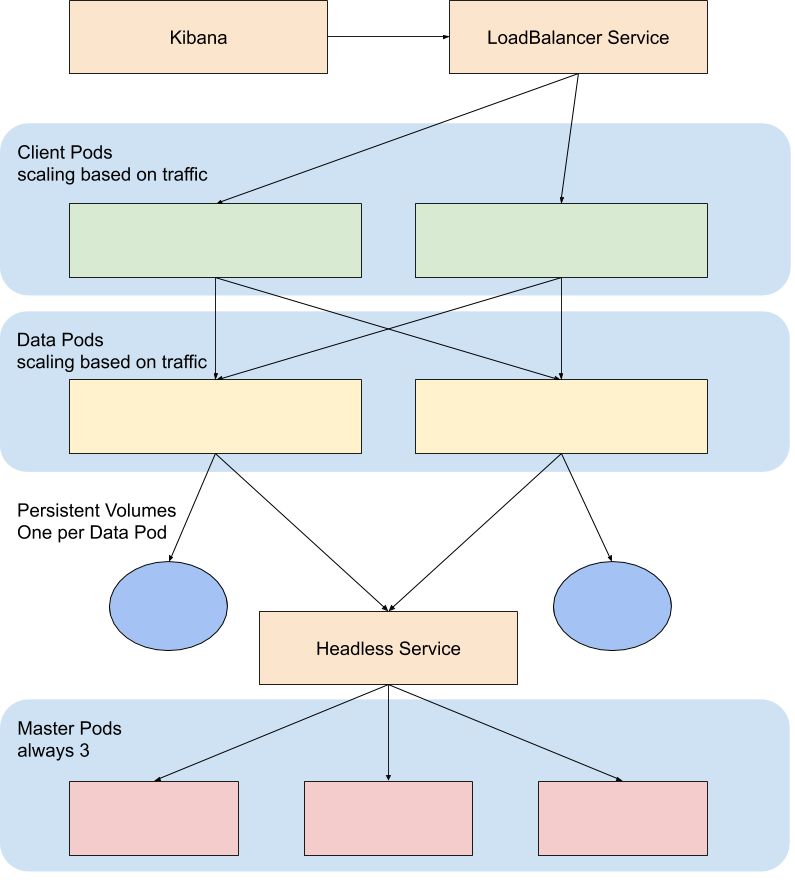
Data Pods are deployed as StatefulSets with PersistentVolumes and PersistentVolumeClaims. They will persist data between restarts, which is what you want.
Master Pods can be deployed as either Deployments or StatefulSets.
A headless service for each StatefulSet is created and used for inter-cluster discovery.
Client Pods are completely stateless and can be deployed as a simple Kubernetes Deployment.
A Kubernetes LoadBalancer Service is used to forward inbound traffic to the client Pods. All of your apps, as well as Kibana will be configured to go through the LoadBalancer service.
Deploying Elasticsearch on Kubernetes: Memory Requirements
If you are setting up an Elasticsearch cluster on Kubernetes for yourself, keep in mind to allocate at least 4GB of memory to your Kubernetes Nodes. You will need at least 7 Nodes to run this setup without any hiccups. The default size of the PersistentVolumeClaims for each Elasticsearch Pod will be 30GB. This will help determine how much block storage you will need.
The pods are inside of a StatefulSet hence when creating new Pods you need to make sure you have 30GB of storage per additional Pod you want to create. Working with PVCs is complicated because you need to delete them yourself. It gets even more complicated when you are not using a cloud service and you have to configure your own StorageClasses. Often Pods won’t start, and it’s most likely due to lack of storage space or old PVCs still persisting even though you don’t need them.
In the next section I’ll show you how to configure both a 7-Pod production setup with Helm, but also how to get up and running quickly with a 3-Pod master setup where each of the Pods has all roles.
How to Deploy Elasticsearch on Kubernetes
Deploying Elasticsearch on Kubernetes can be a hassle if you choose to do it yourself with custom resource files and kubectl. It’s much easier to use Helm, the Kubernetes package manager. With the help of Helm, you can install a prebuilt chart that’ll configure all required resources by running one simple command. Let’s get our hands dirty and start creating the Elasticsearch cluster on Kubernetes.
Prerequisites
To follow along with this tutorial you’ll need a few things first:
- A Kubernetes cluster with role-based access control (RBAC) enabled.
- Ensure your cluster has enough resources available, and if not scale your cluster by adding more Kubernetes Nodes. You’ll deploy a 3-Pod Elasticsearch cluster with 3 master Pods, and a 7-Pod Elasticsearch cluster with 3 master Pods, 2 data Pods, and 2 client Pods. I’d suggest you have 7 Kubernetes Nodes with at least 4GB of RAM and 50GB of storage.
- The kubectl command-line tool installed on your local machine, configured to connect to your cluster. You can read more about how to install kubectl in the official documentation.
- The Kubernetes package manager Helm installed. You can learn how to install Helm inthe official documentation.
Deploying a 3-Pod Elasticsearch cluster on Kubernetes with Helm: Examples and Best Practices
First and foremost you need to initialize Helm on your Kubernetes cluster. It’s done with the init command.
helm initNote: Helm often needs Tiller installed. If the helm init command does not work, run these commands to install Tiller if you do not have it installed and configured.
kubectl create serviceaccount -n kube-system tiller
kubectl create clusterrolebinding tiller-cluster-admin \
  --clusterrole=cluster-admin \
  --serviceaccount=kube-system:tiller
helm init --service-account tiller \
  --override spec.selector.matchLabels.'name'='tiller',spec.selector.matchLabels.'app'='helm' \
  --output yaml | sed 's@apiVersion: extensions/v1beta1@apiVersion: apps/v1@' | kubectl apply -f -
Once you have Helm initialized you can begin adding charts. First start by adding the elastic repo and install the elasticsearch chart.
helm repo add elastic https://helm.elastic.co
helm install --name elasticsearch elastic/elasticsearch \
  --set service.type=LoadBalancer
You’re adding the –set service.type=LoadBalancer parameter to indicate you want the service to expose a LoadBalancer IP to the Internet. Check to see that the resources are running.
kubectl get allThis will list all the resources the chart created.
[output]

NAME                         READY   STATUS     RESTARTS   AGE

pod/elasticsearch-master-0   1/1     Running    0          2m8s

pod/elasticsearch-master-1   1/1     Running    0          2m8s

pod/elasticsearch-master-2   1/1     Running    0          2m8s

NAME                                    TYPE           CLUSTER-IP    EXTERNAL-IP   PORT(S)                         AGE

service/elasticsearch-master            LoadBalancer   10.98.90.94   <YOUR_IP>     9200:31812/TCP,9300:31635/TCP   2m8s

service/elasticsearch-master-headless   ClusterIP      None          <none>        9200/TCP,9300/TCP               2m9s

service/kubernetes                      ClusterIP      10.96.0.1     <none>        443/TCP                         5d5h

NAME                                    READY   AGE

statefulset.apps/elasticsearch-master   3/3     2m8s
You now have three Elasticsearch master Pods running on your Kubernetes cluster. These Pods now have all three available roles. To keep them healthy, make sure you have enough resources allocated. If you need to scale up, you can configure a Pod autoscaler. To check if everything is running like it should, hit the Elasticsearch state endpoint with curl.
curl http://<YOUR_IP>/_cluster/state?prettyThis setup will work great for smaller clusters where you don’t have huge amounts of data. Some issues you may run into are out of memory exceptions when your indices start growing. In that case you should increase the sysctl max_map_count. Here’s a nice thread explaining it.
But, if you want to follow Elasticsearch best practices you should also configure dedicated data and client Pods apart from master Pods. That’s exactly what we’re doing in the next section.
Deploying a 7-Pod Elasticsearch cluster on Kubernetes with Helm
Let’s get serious for a moment, and configure the cluster with best practices in mind. The 7 Pods will consist of 3 master Pods, 2 data Pods, and 2 client Pods.
This preferred setup is installed in a similar way. First, run the Helm install command, but this time without any additional parameters.
helm install --name elasticsearch elastic/elasticsearch
Now you need to run the upgrade command to update the Elasticsearch pods. You want to upgrade the number of Pods but also assign custom roles to them.
To do this create three yaml config files. First the master.yaml to configure the master-eligible Pods.
# master.yaml
---
clusterName: "elasticsearch"
nodeGroup: "master"
roles:
  master: "true"
  ingest: "false"
  data: "false"
replicas: 3
Then the data.yaml for the data Pods.
---
clusterName: "elasticsearch"
nodeGroup: "data"
roles:
  master: "false"
  ingest: "true"
  data: "true"
replicas: 2
Finally, the client.yaml for the client Pods.
---
clusterName: "elasticsearch"
nodeGroup: "client"
roles:
  master: "false"
  ingest: "false"
  data: "false"
replicas: 2
service:
  type: "LoadBalancer"
Now you can run the upgrade command three times, with each distinct yaml config file in the directory where you created the files.
helm upgrade --wait --timeout=600 --install \
  --values ./master.yaml elasticsearch elastic/elasticsearch

helm upgrade --wait --timeout=600 --install \
  --values ./data.yaml elasticsearch elastic/elasticsearch

helm upgrade --wait --timeout=600 --install \
  --values ./client.yaml elasticsearch elastic/elasticsearch
It’ll take a while to upgrade the Helm chart. But, when they are all finished upgrading you can check if your resources are updated.
kubectl get allHere’s the output you’re looking for.
[Output]

NAME                                    READY   STATUS    RESTARTS   AGE

pod/elasticsearch-client-0              1/1     Running   0          10m

pod/elasticsearch-client-1              1/1     Running   0          10m

pod/elasticsearch-data-0                1/1     Running   0          11m

pod/elasticsearch-data-1                1/1     Running   0          11m

pod/elasticsearch-master-0              1/1     Running   0          8m27s

pod/elasticsearch-master-1              1/1     Running   0          8m27s

pod/elasticsearch-master-2              1/1     Running   0          8m27s

NAME                                    TYPE           CLUSTER-IP       EXTERNAL-IP     PORT(S)                         AGE

service/elasticsearch-client            LoadBalancer   10.245.114.89    <YOUR_IP>       9200:32366/TCP,9300:31427/TCP   10m

service/elasticsearch-client-headless   ClusterIP      None             <none>          9200/TCP,9300/TCP               10m

service/elasticsearch-data              ClusterIP      10.245.116.115   <none>          9200/TCP,9300/TCP               11m

service/elasticsearch-data-headless     ClusterIP      None             <none>          9200/TCP,9300/TCP               11m

service/elasticsearch-master            ClusterIP      10.245.220.94    <none>          9200/TCP,9300/TCP               8m27s

service/elasticsearch-master-headless   ClusterIP      None             <none>          9200/TCP,9300/TCP               8m27s

service/kubernetes                      ClusterIP      10.245.0.1       <none>          443/TCP                         4h5m

NAME                                    READY   AGE

statefulset.apps/elasticsearch-client   2/2     10m

statefulset.apps/elasticsearch-data     2/2     11m

statefulset.apps/elasticsearch-master   3/3     8m28s
Run curl against the Elasticsearch endpoint once again to check if it works.
curl http://<YOUR_IP>/_cluster/state?prettyThere ya go! Ready to rock!
Note: If you’re having issues with configuring larger clusters, you might need to check out setting up readiness probes. They can check whether your Elasticsearch Pods are ready to accept traffic.
Bonus: Prebuilt Elasticsearch Helm chart with best practices in mind
The peeps over at Bitnami have created a greatChart with preconfigured settings for Elasticsearch master, data, and client Pods. All you need to do is run two commands.
helm repo add bitnami
helm install --name elasticsearch --set \
  name=elasticsearch,master.replicas=3,coordinating.service.type=LoadBalancer bitnami/elasticsearch
Check the kubectl get all output once again to make sure everything is in order.
[Output]

NAME                                                                 READY   STATUS    RESTARTS   AGE

pod/elasticsearch-elasticsearch-coordinating-only-694b5f94f8-896k5   1/1     Running   0          3m55s

pod/elasticsearch-elasticsearch-coordinating-only-694b5f94f8-jvdrn   1/1     Running   0          3m55s

pod/elasticsearch-elasticsearch-data-0                               1/1     Running   0          3m55s

pod/elasticsearch-elasticsearch-data-1                               1/1     Running   0          3m27s

pod/elasticsearch-elasticsearch-master-0                             1/1     Running   0          3m55s

pod/elasticsearch-elasticsearch-master-1                             1/1     Running   0          3m35s

pod/elasticsearch-elasticsearch-master-2                             1/1     Running   0          3m16s

NAME                                                    TYPE           CLUSTER-IP      EXTERNAL-IP      PORT(S)          AGE

service/elasticsearch-elasticsearch-coordinating-only   LoadBalancer   10.245.13.251   <YOUR_IP>        9200:32270/TCP   3m56s

service/elasticsearch-elasticsearch-discovery           ClusterIP      None            <none>           9300/TCP         3m56s

service/elasticsearch-elasticsearch-master              ClusterIP      10.245.0.78     <none>           9300/TCP         3m56s

service/kubernetes                                      ClusterIP      10.245.0.1      <none>           443/TCP          30m

NAME                                                            READY   UP-TO-DATE   AVAILABLE   AGE

deployment.apps/elasticsearch-elasticsearch-coordinating-only   2/2     2            2           3m55s

NAME                                                                       DESIRED   CURRENT   READY   AGE

replicaset.apps/elasticsearch-elasticsearch-coordinating-only-694b5f94f8   2         2         2       3m55s

NAME                                                  READY   AGE

statefulset.apps/elasticsearch-elasticsearch-data     2/2     3m56s

statefulset.apps/elasticsearch-elasticsearch-master   3/3     3m56s
All that’s left now is to deploy Kibana on the Kubernetes cluster to visualise your data.
How to Deploy Kibana on Kubernetes
Once you have your Elasticsearch cluster up and running on Kubernetes, you can use Kibana to manage and monitor it.
Kibana is a simple tool to visualize Elasticsearch data. To run Kibana you need to provide the name of the Elasticsearch client Service as an environment variable so the Kibana Pod knows where to connect to.
You’ll use a LoadBalancer Service to access the Kibana deployment. If you wish, you can only expose it internally instead.
To add Kibana you use theofficial Helm chart. Go ahead and run the Helm install command.
Make sure to replace the placeholder with the Service name of your client. The default would be elasticsearch-master if you followed the 3-Pod guide, elasticsearch-client if you followed the 7-Pod guide, or elasticsearch-elasticsearch-coordinating-only if you installed the Bitnami Helm chart.
helm install --name kibana elastic/kibana --set \
  elasticsearchHosts=http://<CLIENT_SERVICE_NAME>:9200 \
  service.type=LoadBalancer
Like always, check to make sure Kibana is running after installing the Helm chart.
kubectl get all[Output]
NAME READY STATUS RESTARTS AGE
...
pod/kibana-kibana-74bf9fc5f5-sxx4g 1/1 Running 0 1m12s
NAME TYPE CLUSTER-IP EXTERNAL-IP PORT(S) AGE
...
service/kibana-kibana LoadBalancer 10.245.195.198 <YOUR_KIBANA_IP> 5601:31362/TCP 20s
service/kubernetes ClusterIP 10.245.0.1 <none> 443/TCP 69m
NAME READY UP-TO-DATE AVAILABLE AGE
deployment.apps/kibana-kibana 1/1 1 1 1m12s
NAME DESIRED CURRENT READY AGE
replicaset.apps/kibana-kibana-74bf9fc5f5 1 1 0 1m12s
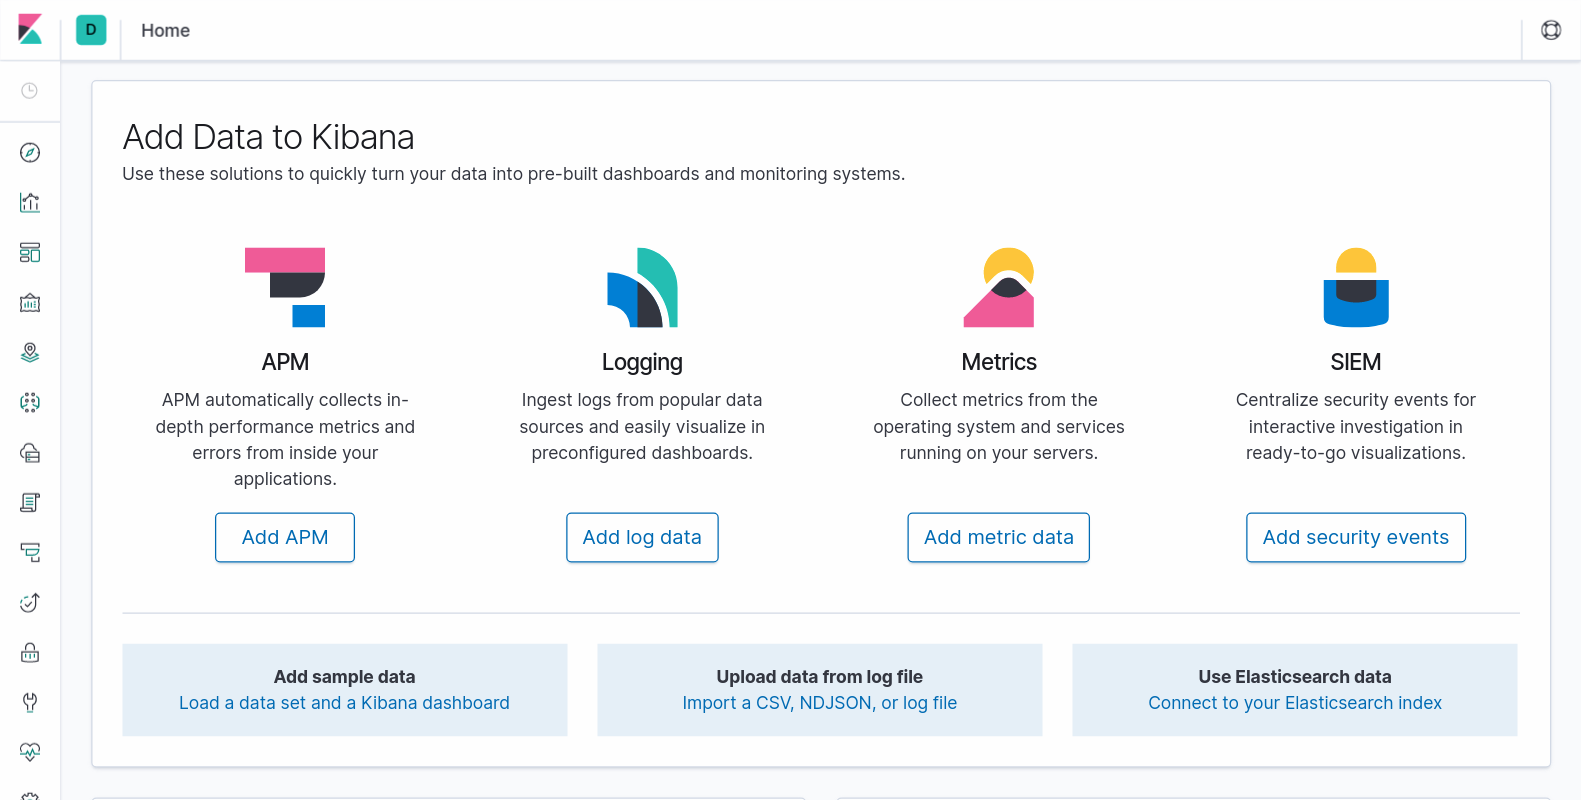
...With that, you’re done! Open up http://<YOUR_KIBANA_IP>:5601 and you can see Kibana running.
Wrapping Up
In this tutorial you learned about Elasticsearch and Kubernetes clusters, and how to run and deploy Elasticsearch on Kubernetes. Now you know about best practices, hardware requirements, and tips and tricks on how to maintain a stateful Elasticsearch cluster on Kubernetes.
You’ve created three setups with different numbers of Pods with different roles, while managing state with persistent volumes. By now you know the architectural overview of both how to create a solid Elasticsearch cluster but also how to organize resources in a Kubernetes cluster.
You’ve also installed Kibana so you can interact with the data stored in Elasticsearch, and interacted with the Elasticsearch REST API using curl.
This article has been published from a wire agency feed without modifications to the text. Only the headline has been changed.


