Time to first byte, first contentful paint, DNS response time, round-trip time, and the list goes on and on. With all of these metrics, how are you supposed to know which are the most important ones that you should monitor?
To understand what those numbers are supposed to look like, you’ll have to get a reference point. Something that’s supposed to give you a starting point. A number that you’ll be able to compare to future results to understand if your performance improved or degraded over time. This process is called website performance benchmarking.
Why Benchmark Your Website?
You’ll want to run benchmarks on your website because having insights on how it performs will allow you to make decisions that will ensure a competitive edge. It will paint a clearer picture of where you stand compared to your competition and what areas can be improved or need your immediate attention.
What Metrics To Benchmark
Indeed, each metric can provide insights into performance and where you stand in relation to other similar-sized sites in the same industry. However, there are dozens of metrics to look at, which can make users lose focus on those that are important. To help you get started, I selected the main metrics I recommend you should monitor for benchmarking purposes:
- TTFB – time to first byte, a website performance metric that tells you how fast your server responds with the first package.
- Page size – the total size of all your CSS, javascript, images, HTML.
- Number of requests – each time you load a file, image, or script, you’ll create a request. The more you have, the more time the server will take serving them.
- First Contentful Paint – the moment your hero section is visible and fully loaded
- TTI – time to interactive, the metric that tells you the moment the site can respond to user input.
- Page speed and load time – this is the point where every single resource is fully loaded and can respond to user input.
I could go on for a while, but I think these are the ones you should start with. They give you a solid baseline for benchmarking and provide intel as far as any performance issues you might be having and give data to compare with your competitors.
I’d suggest making a note of the first benchmark and the values you are seeing. You’ll want to come back periodically and check against them to understand where you stand as time passes.
How To Benchmark a Website: Benchmarking Example
This process first involves finding a benchmark website to gather results against. As a starting point, HTTP Archive offers some interesting statistics about the average website’s size by content, individual response time, HTML document transfer size, and so on. However, this information is quite generic and not specific to a particular industry which may be known for fast loading sites.
This is where benchmarking tools come into play. Tools like Sematext Synthetics, our synthetic monitoring software, can help you run a wide range of tests on your website like load times, third party APIs stability, web performance across multiple devices, and much more.
Getting Sematext Synthetic set up is quite easy. After you’ve signed up for a free account, you can start adding the properties you want to monitor.
You either create a project or use one that’s already there. For this example, you’ll go with Browser Monitors. Select the regions you want your website the request to come from and hit next.
On this step, you’ll describe precisely the type of action you want to request. It can be basic such as “open the site and take a snapshot,” or go as deep as “sign in and add to cart.” Sematext offers many pieces of code as examples, so there’s not going to be a lot of fidgeting around trying to figure out the right code.
For my example I went with:
<script>
// This script loads the webpage and takes a screenshot of the loaded page.
async function testPage(page) {
  // Replace <YOUR-WEBPAGE-URL> with URL of the webpage to be monitored
  await page.goto("<YOUR-WEBPAGE-URL>");
  await page.screenshot({ path: 'screenshot.png' });
}
module.exports = testPage;
</script>
The last step before going Live with the monitor is setting up the alerts. These are thresholds that will trigger notifications whenever certain conditions are met.
You can have multiple conditions here and, as you might have figured it out, you have to set a threshold value for each one and hit “Create.”
And with that, you’ve got yourself all set up and ready to start benchmarking your website at a preset interval. The alerts you have set up based on the criteria selected above will send you a message the second your website starts “Acting up.” This will ensure you’ll get to have an early warning system that will let you tackle issues before they impact your users and their satisfaction level.
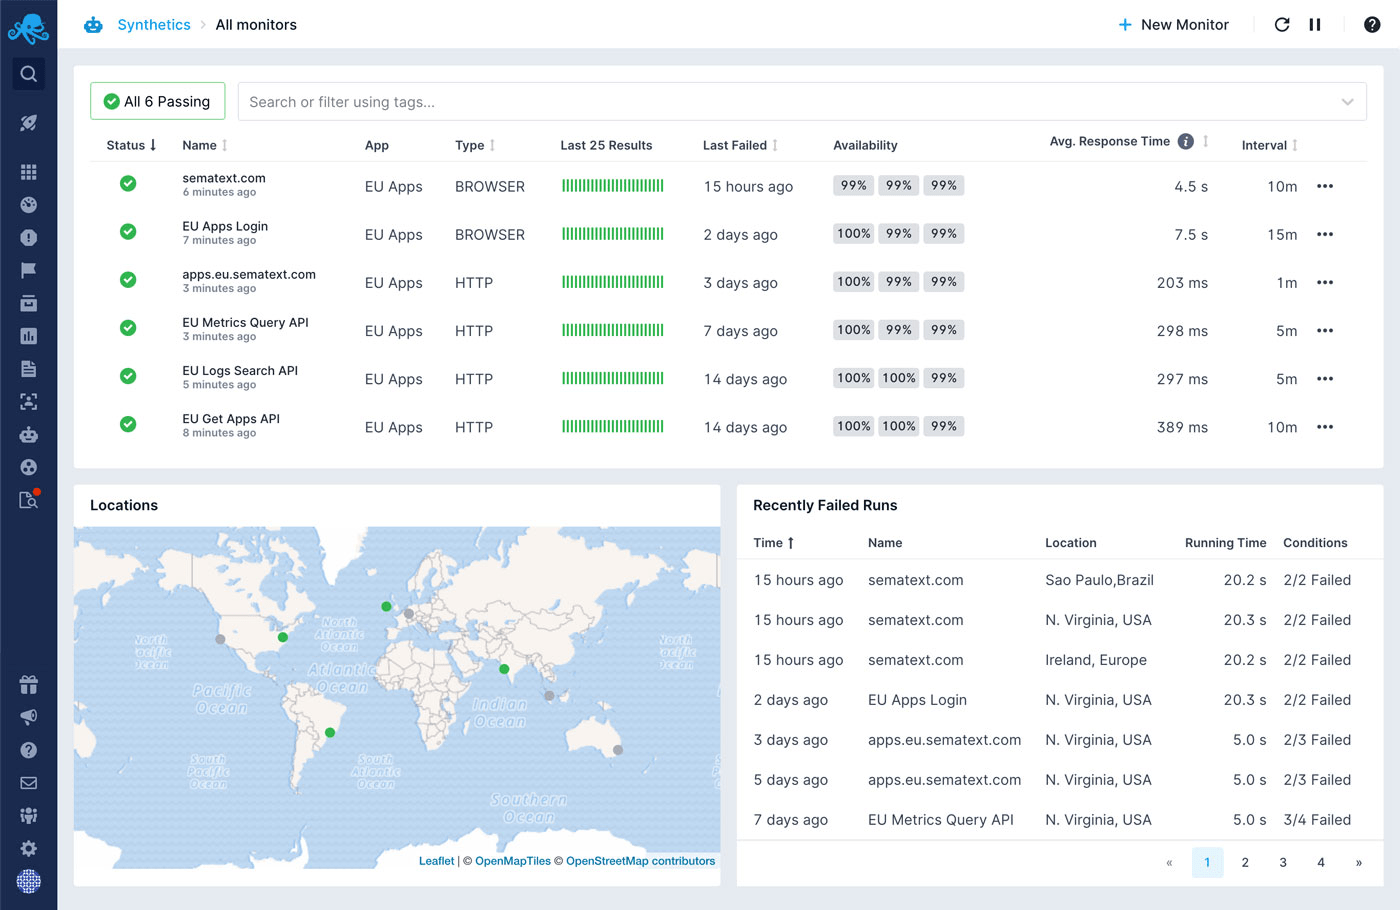
The dashboard will give you a bird’s-eye view of all the websites you monitor and details on their current status, latest failures, average response time, and other valuable information.

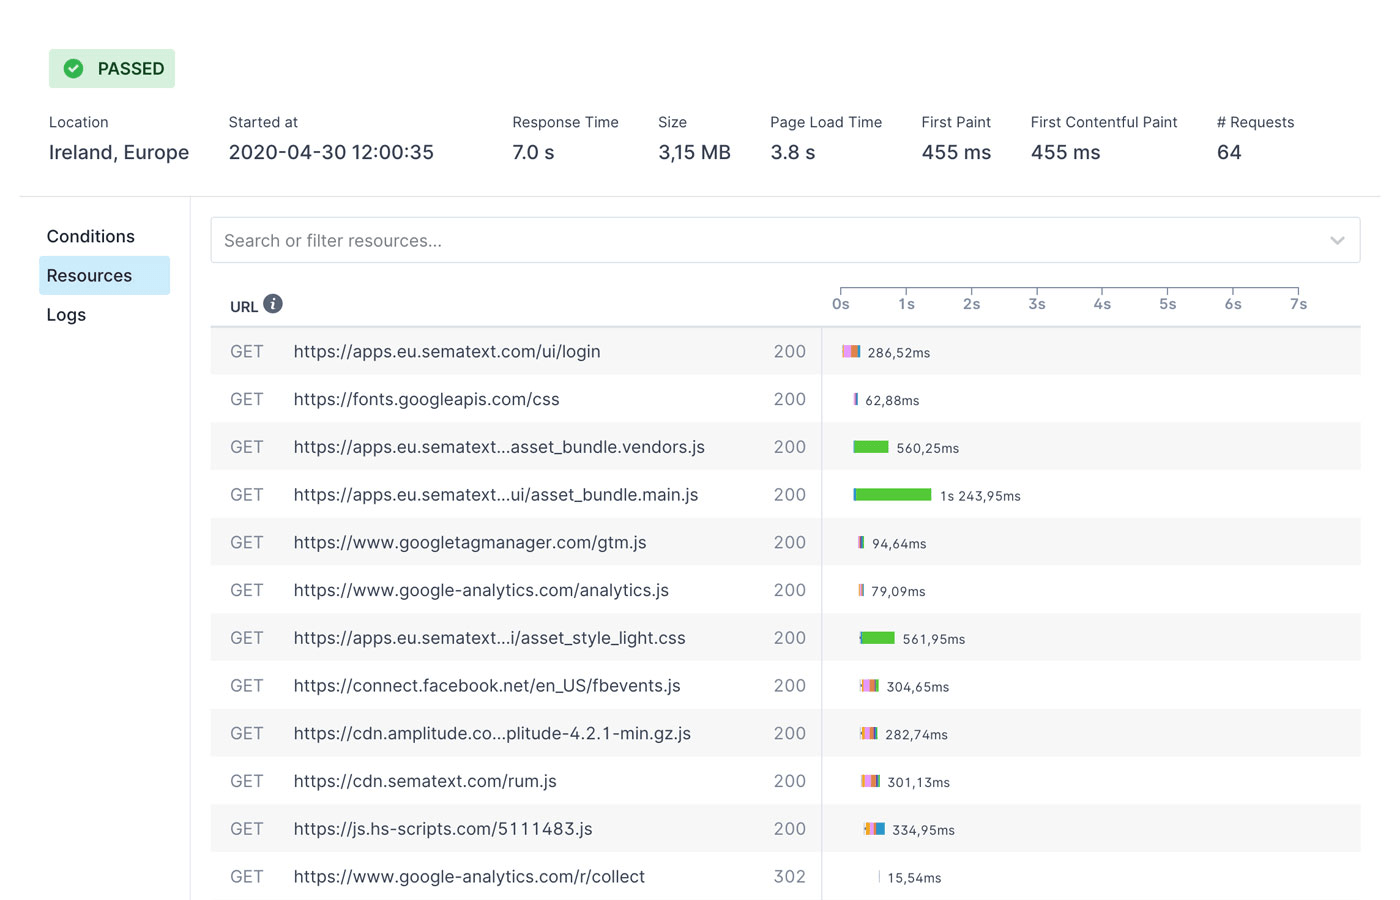
But it’s only when you start digging a little deeper that you get into the more impressive parts of Sematext Synthetics. You can look at individual tests and see how the website performed and if they meet the criteria you’ve previously established. You’ll get to see the loaded resources, the logs that were sent back and forth, details on page size, response time, number of requests, and many more.

Website Benchmarking Best Practices
Just like pretty much everything else, there are certain benchmarking pet peeves that you should be aware of, little details that you should keep in mind when performing a benchmark analysis.
1. Compare with similar web pages
When picking pages, you want to benchmark against, make sure you pick similar ones. Testing a product page vs. a category page of an ecommerce website will get you some really skewed results and might not provide the valuable information you were looking for.
2. Test multiple locations and devices
Your users will use your website from different locations around the world and your website needs to be able to serve people in India just as fast as people in the US. Some may use mobile devices while others will use laptops, so keeping this in mind will provide a better understanding of how latency affects their user experience.
3. Benchmark against competitors instead of averages
Averages can be misleading when you compare sites from different industries. If you take the average page speed of google.com and compare it against your e-commerce store that has 100K+ products, it will make you think your site is way off in terms of performance even though this might not necessarily be the case.
Instead of just looking at averages, you should compare your performance with that of your competitors. This provides a real industry average that what you are probably used to.
4. Dig deeper
Load time is a good general indicator of website performance, but it might not be the right thing to look at. You’ll want to dig a little deeper to understand how your users are experiencing your website, and the first metrics to look at are time to first byte and time to interactive. After you’ve’ established these two, you can move on to others like round trip time, request numbers, etc.
5. Understand what your site “does” when you are not looking
You can’t run manual tests on your website all the time. Instead, you want to schedule these tests to make sure your performance remains consistent throughout the day. Scheduling tests at specific times and from different locations will give you a better idea of how your website performs.
6. Monitor third-party APIs
Actually, they can be trusted but as the Russian proverb goes, “Trust but verify.” So, make sure you monitor your APIs because they can heavily impact how users experience your website.
Conclusion
As I’ve already mentioned, website benchmarking, while sounding complicated, is a rather simple process that will help you establish a starting point for your performance. It will let you know the baseline you’ll have to work with and help evaluate your website with that of your competitors.
A thorough benchmark analysis gives you all the information you need to optimize your site by pinpointing exactly where the problem areas are.
This article has been published from a wire agency feed without modifications to the text. Only the headline has been changed.


