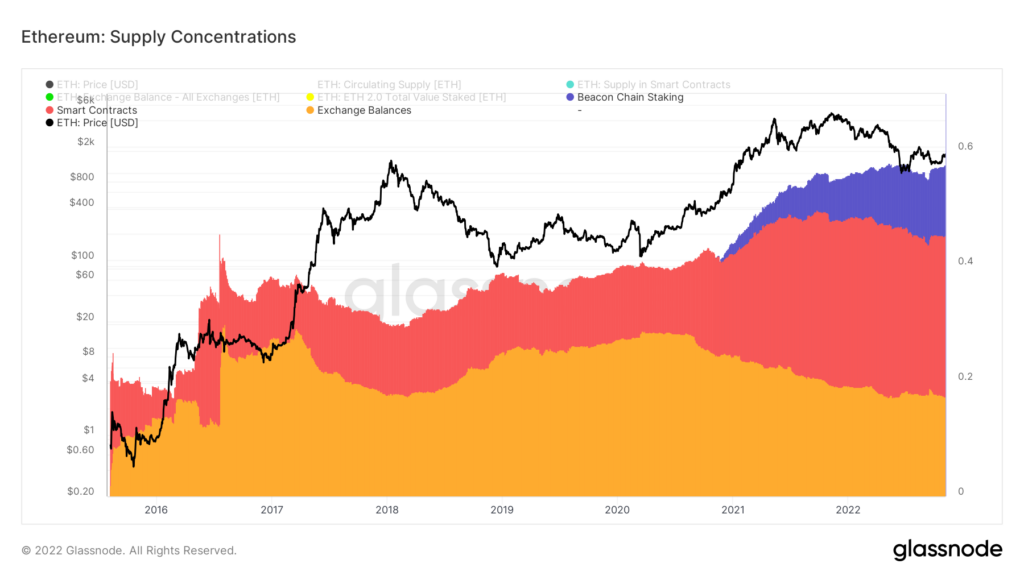
Post-merge, the share of Ethereum’s supply that is concentrated in smart contracts has increased to an all-time high. Currently, 0.45% of all Ethereum is created by smart contracts, placing them behind staked Ethereum (0.57%) and exchange balances (0.17%).
Some of the highest concentrations of the Ethereum supply are seen in the area view in the graphic below. From bottom to top, supply regions are represented as a ratio of circulating supply. Yellow, red, and purple respectively represent the supply held on exchanges, smart contracts, and staked on the beacon chain, respectively.
The information demonstrates the areas in which fresh Ethereum is being distributed, providing information about network activity for new coins. While smart contracts and staking have expanded since late 2020, the concentration of supply on exchanges has decreased after mid-2020.

The entire amount of Ethereum in circulation after the ICO’s launch in 2014 was 72 million ETH. It had hit 120,534,150 ETH at the time of The Merge and has since decreased by roughly 10,000 ETH. On October 27, the circulating supply reached a post-merge low before modestly increasing during the beginning of November.
The majority of Ethereum’s new supply came from mining, which led to a triple halving after The Merge. Mining led to the daily creation of almost 13,000 ETH. The new supply was decreased by around 99% once mining was eliminated from the network. Only 3,000 ETH are generated by staking each day, and as of the time of publication, 1,172 ETH were burned per day.
The concentration of the total supply may be divided into Ethereum accounts, smart contracts, and validators. Accounts own 72% of the overall supply, followed by smart contracts with 15% and validators with 13%.


